
Highlights
- Asahi Songwon Colors shares gained over 9% and entered the list of top gainers.
- The stock is trading above its 50-day SMA, reflecting an improving technical structure.
- Strong quarterly profitability and rising momentum supported the upward move.
Overview
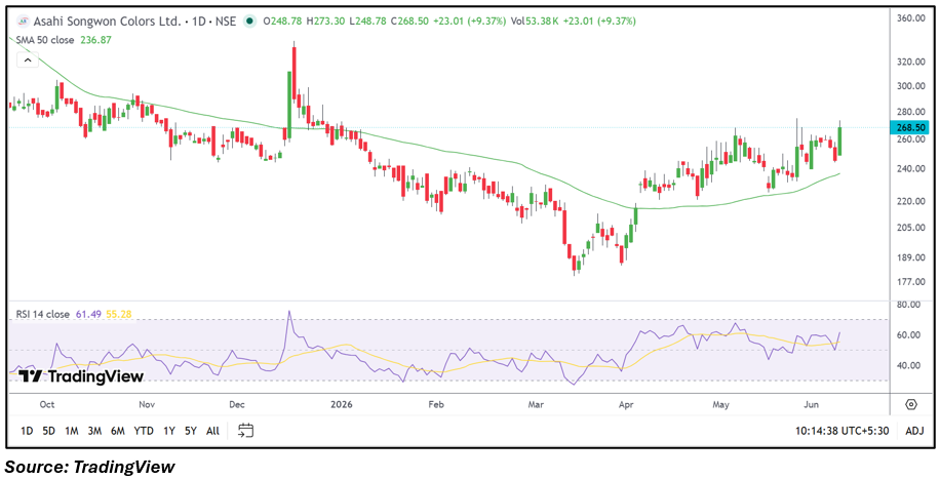
Asahi Songwon Colors (NSE: ASAHISONG) surged 9.37% to ₹268.50 on June 9, outperforming the broader market and emerging among the session's top gainers. The stock opened at ₹248.78 and advanced to an intraday high of ₹273.30 before consolidating near the upper end of the day's range. The move extended the stock's recovery trend and kept it above its 50-day Simple Moving Average (SMA) of ₹236.87.
Fundamental View
For the quarter ended March 2026, Asahi Songwon Colors reported standalone total income of ₹9,535.04 lakh. The company posted a profit before tax of ₹1,372.93 lakh and net profit of ₹976.99 lakh. Earnings per share came in at ₹8.29. The latest quarterly performance reflects continued profitability, which may have contributed to positive sentiment around the stock.
Technical View
Asahi Songwon Colors is trading at ₹268.50, comfortably above its 50-day SMA of ₹236.87. Price action has been forming a sequence of higher lows since the March bottom, indicating an improving trend structure. The stock recently rebounded from the ₹240 zone and has now approached its recent swing highs. The 14-day RSI stands at 61.49, remaining above the neutral mark and indicating positive momentum. The latest advance suggests buyers remain active as the stock attempts to extend its recovery.
Momentum Indicator
The RSI reading of 61.49 points to strengthening momentum and improving market participation. While the indicator remains below overbought territory, it reflects a constructive technical setup compared with earlier months.
Key Technical Levels
On the downside, immediate support is placed near ₹255.08, while a stronger support zone is seen around ₹241.65. On the upside, resistance is positioned near ₹281.93. A sustained move above this level could bring the next resistance zone around ₹295.35 into focus.
Key Risks to Watch
- Profit booking after the recent rally.
- Raw material cost fluctuations affecting margins.
- Failure to sustain above key support levels.
- Broader weakness in specialty chemical stocks.
Summary
Asahi Songwon Colors emerged among the market's top gainers after climbing 9.37% to ₹268.50. The stock remains above its 50-day SMA of ₹236.87, while the RSI at 61.49 indicates positive momentum. With profitability reported in the latest quarter and price action approaching recent highs, traders may watch whether the stock can sustain its recovery and challenge higher resistance zones.
FAQs
- Why did Asahi Songwon Colors shares rise today?
The stock gained sharply amid positive momentum and continued recovery above its key moving average. - Is Asahi Songwon Colors trading above its 50-day SMA?
Yes, the stock is trading above its 50-day SMA of ₹236.87. - What does the RSI indicate for ASAHISONG?
The RSI of 61.49 suggests improving momentum and a constructive near-term technical setup.