

Highlights
- Aequs shares declined nearly 8% after the company reported quarterly losses.
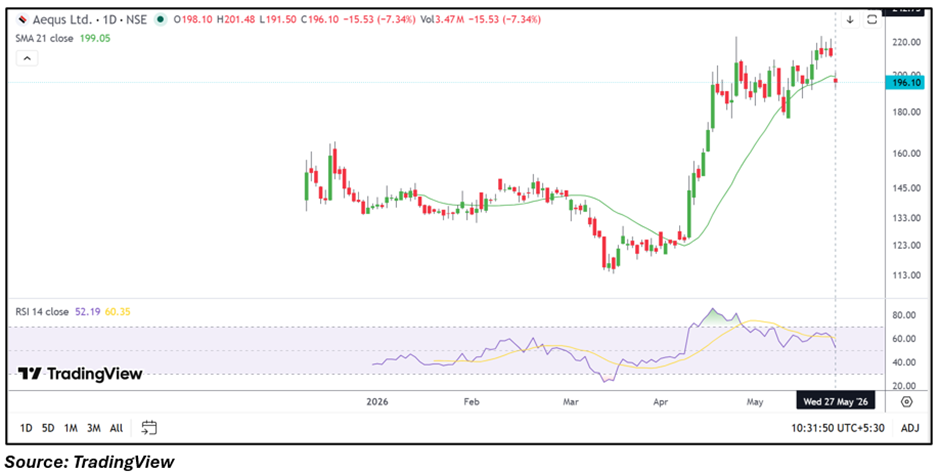
- The stock slipped below its 21-day SMA amid weakening short-term sentiment.
- Traders are closely tracking support levels near INR 180 after the sharp correction.
Overview
Aequs (NSE: AEQUS) shares remained under pressure on Wednesday after the company announced its latest quarterly earnings. The stock fell more than 7% during the session as investors reacted to the company’s reported losses and rising volatility in the counter.
The company reported consolidated total income of INR 39,503.80 lakh for the quarter ended March 2026. Profit before tax stood at a loss of INR 3,327.70 lakh, while net loss came in at INR 5,372.10 lakh. Earnings per share for the quarter was reported at negative INR 0.81.
Fundamental View
Market participants appeared cautious after the latest earnings update reflected continued pressure on profitability. Despite reporting revenue during the quarter, the company posted losses at both the pre-tax and net levels, which may have weighed on investor sentiment.
The sharp decline also came after a strong rally phase in recent months, resulting in profit-booking activity as traders reassessed valuations and near-term business visibility.
Technical View
Aequs stock traded near INR 195.79 while slipping marginally below its 21-day SMA near INR 199.05, reflecting weakening short-term structure. The stock also witnessed sustained selling pressure after failing to hold near the recent higher zone around INR 210.
The 14-day RSI moved near 52.19, indicating momentum has moderated from earlier elevated levels. Price action suggests traders are now monitoring whether the stock stabilizes around immediate support zones.
Momentum Indicator
Momentum conditions softened following the recent correction, with RSI moving closer to neutral territory. Volatility may remain elevated as the market evaluates whether the recent decline was temporary profit-booking or reflects broader caution after the earnings update.
Key Technical Levels
Aequs stock is currently witnessing immediate support near INR 180–170. A sustained hold above this range may help stabilize sentiment in the near term. On the upside, resistance is placed near INR 210–220, which traders may closely monitor during recovery attempts.
Risks to Watch
- Continued quarterly losses may affect near-term investor confidence.
- Elevated volatility could trigger further sharp price swings.
- Weak broader market sentiment may pressure mid-cap stocks.
- Profit-booking activity can remain high after recent rally phases.
Summary
Aequs shares corrected sharply after the company reported quarterly losses despite posting revenue growth during the latest quarter. The stock has now slipped below its short-term moving average, while momentum indicators have cooled from recent highs. Traders are closely watching whether support levels hold firm or if weakness continues in the coming sessions.
FAQs
Why did Aequs shares fall today?
The stock declined after the company reported quarterly losses and witnessed increased selling pressure.
What are the key support levels for Aequs stock?
Immediate support for the stock is placed near INR 180–170.
Which resistance levels are important for Aequs shares?
Traders are closely tracking the INR 210–220 resistance zone.