
Highlights
- Marsons shares surged over 13% and emerged among the market's top gainers.
- The stock rebounded sharply from recent lows despite trading below its 50-day SMA.
- Quarterly earnings remained profitable, supporting improved investor sentiment.
Overview
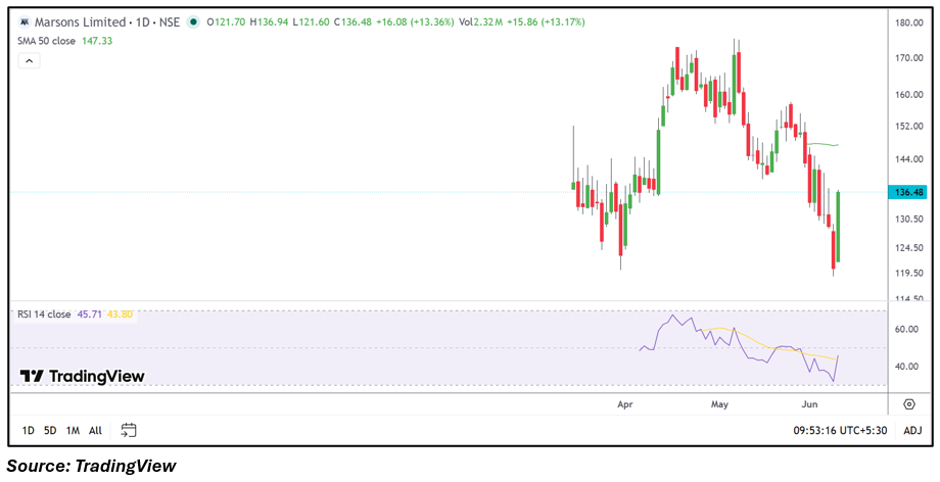
Marsons Limited (NSE: MARSONS) gained sharply on June 9, with the stock rising 13.13% to ₹136.06. The move came after the stock witnessed significant weakness in recent weeks, making today's rebound notable. While the stock remains below its 50-day Simple Moving Average (SMA) of ₹147.33, the strong recovery from intraday lows suggests renewed buying interest after the recent correction.
Fundamental View
For the quarter ended March 2026, Marsons reported standalone total income of ₹9,225.93 lakh. The company posted a profit before tax of ₹1,850.51 lakh and a net profit of ₹2,257.79 lakh. Earnings per share stood at ₹1.31. The latest results indicate that the company remained profitable during the reporting period, providing a fundamental backdrop to the recent recovery in the stock price.
Technical View
Marsons is trading at ₹136.06 while remaining below its 50-day SMA of ₹147.33, indicating that the broader trend has yet to fully recover. However, the stock staged a sharp rebound after recently falling near the ₹120 region. Price action shows buyers stepping in after a steep decline, helping the stock reclaim a portion of its recent losses. The 14-day RSI stands at 45.71, recovering from lower levels and suggesting that bearish momentum has eased.
Momentum Indicator
The RSI reading of 45.71 remains below the neutral 50 mark but has improved from recent lows. This indicates that selling pressure has moderated and momentum is attempting to stabilize following the sharp rebound.
Key Technical Levels
On the downside, immediate support is placed near ₹129.26, while a stronger support zone is seen around ₹122.45. On the upside, resistance is positioned near ₹142.86. A sustained move above this level could bring the next resistance zone around ₹149.67 into focus.
Key Risks to Watch
- Stock remains below its 50-day SMA.
- Volatility after the recent sharp rebound.
- Momentum remains below the neutral RSI zone.
- Small-cap stocks can witness sudden price swings.
Summary
Marsons emerged among the day's top gainers after rebounding strongly from recent lows. Although the stock remains below its 50-day SMA of ₹147.33, the recovery suggests improving sentiment after a period of weakness. With RSI at 45.71 and profitability reported in the latest quarter, traders may watch whether the stock can sustain momentum and challenge nearby resistance zones.
FAQs
- Why did Marsons shares rise today?
The stock rebounded sharply from recent lows, helping it emerge among the market's top gainers. - Is Marsons trading above its 50-day SMA?
No, the stock is currently trading below its 50-day SMA of ₹147.33. - What does the RSI indicate for Marsons?
The RSI of 45.71 suggests momentum is recovering but remains below the neutral level.