Why Kalkine ?
Empower your Decisions through Kalkine’s Tech-Driven Stock Research

Professionally Managed

Performance Transparency

Loading market ticker...

Empower your Decisions through Kalkine’s Tech-Driven Stock Research
Entry Price:
Entry Price:
Entry Price:
Entry Price:
| Ticker | Name | Price(INR) | Change(INR) | %Change |
|---|---|---|---|---|
| YASHO | Yasho Industries Ltd. | 3858.70 | 643.10 |
 Uptrend
20.00%
Uptrend
20.00%
|
| UEL | Ujaas Energy Ltd. | 153.73 | 25.62 |
Uptrend
20.00%
|
| TRANSPEK | Transpek Industry Ltd. | 1321.30 | 220.20 |
Uptrend
20.00%
|
| RSDFIN | RSD Finance Ltd. | 110.74 | 18.45 |
Uptrend
19.99%
|
| DCI | DC Infotech and Communication Ltd. | 329.70 | 52.95 |
Uptrend
19.13%
|
Data Powered by Accord Fintech
| Ticker | Name | Price(INR) | Change(INR) | %Change |
|---|---|---|---|---|
| GFSTEELS | Grand Foundry Ltd. | - | -14.29 |
 Downtrend
100.00%
Downtrend
100.00%
|
| EXPLEOSOL | Expleo Solutions Ltd. | 802.85 | -103.75 |
Downtrend
11.44%
|
| THANGAMAYL | Thangamayil Jewellery Ltd. | 5226.50 | -580.5 |
Downtrend
10.00%
|
| ASIANTILES | Asian Granito India Ltd. | 54.68 | -6.03 |
Downtrend
9.93%
|
| SIGNPOST | Signpost India Ltd. | 283.55 | -27.65 |
Downtrend
8.89%
|
Data Powered by Accord Fintech
| Ticker | Name | Price(INR) | Change(INR) | %Change |
|---|---|---|---|---|
| YASHO | YASHO INDUSTRIES ORD (BSE) | 3858.7 | 643.10 |
Uptrend
20.00%
|
| ESAFSFB | ESAF Small Finance Bank | 42.7 | 6.22 |
Uptrend
17.05%
|
| SCPL | Sheetal Cool Products Limited | 615.0 | 63.85 |
Uptrend
11.58%
|
| DEEPINDS | Deep Industries Limited | 598.0 | 49.20 |
Uptrend
8.97%
|
| BAJFINANCE | Bajaj Finance Limited | 1141.2 | 83.20 |
Uptrend
7.86%
|
Data Powered by EOD Historical Data (“EODHD”)
| Ticker | Name | Price(INR) | Change(INR) | %Change |
|---|---|---|---|---|
| NUCLEUS | Nucleus Software Exports Limited | 683.1 | -55.05 |
Downtrend
7.46%
|
| APTUS | Aptus Value Housing Finance India Limited | 260.5 | -16.7 |
Downtrend
6.02%
|
| SAPPHIRE | Sapphire Foods India Limited | 184.45 | -10.8 |
Downtrend
5.53%
|
| ALLDIGI | Alldigi Tech Limited | 810.6 | -44.5 |
Downtrend
5.20%
|
| GOCOLORS | Go Fashion (India) Limited | 325.85 | -17.15 |
Downtrend
5.00%
|
Data Powered by EOD Historical Data (“EODHD”)
Elevate your Investment Experience with Kalkine’s Expert Research and Analytics
Consistent dividend paying stocks with growth potential.
This report offers in-depth analysis of top Indian IPOs set to launch.
Explore Algo-Based ‘Buy’ or ‘Sell’ Trading Signals on NSE listed stocks tested by certified experts
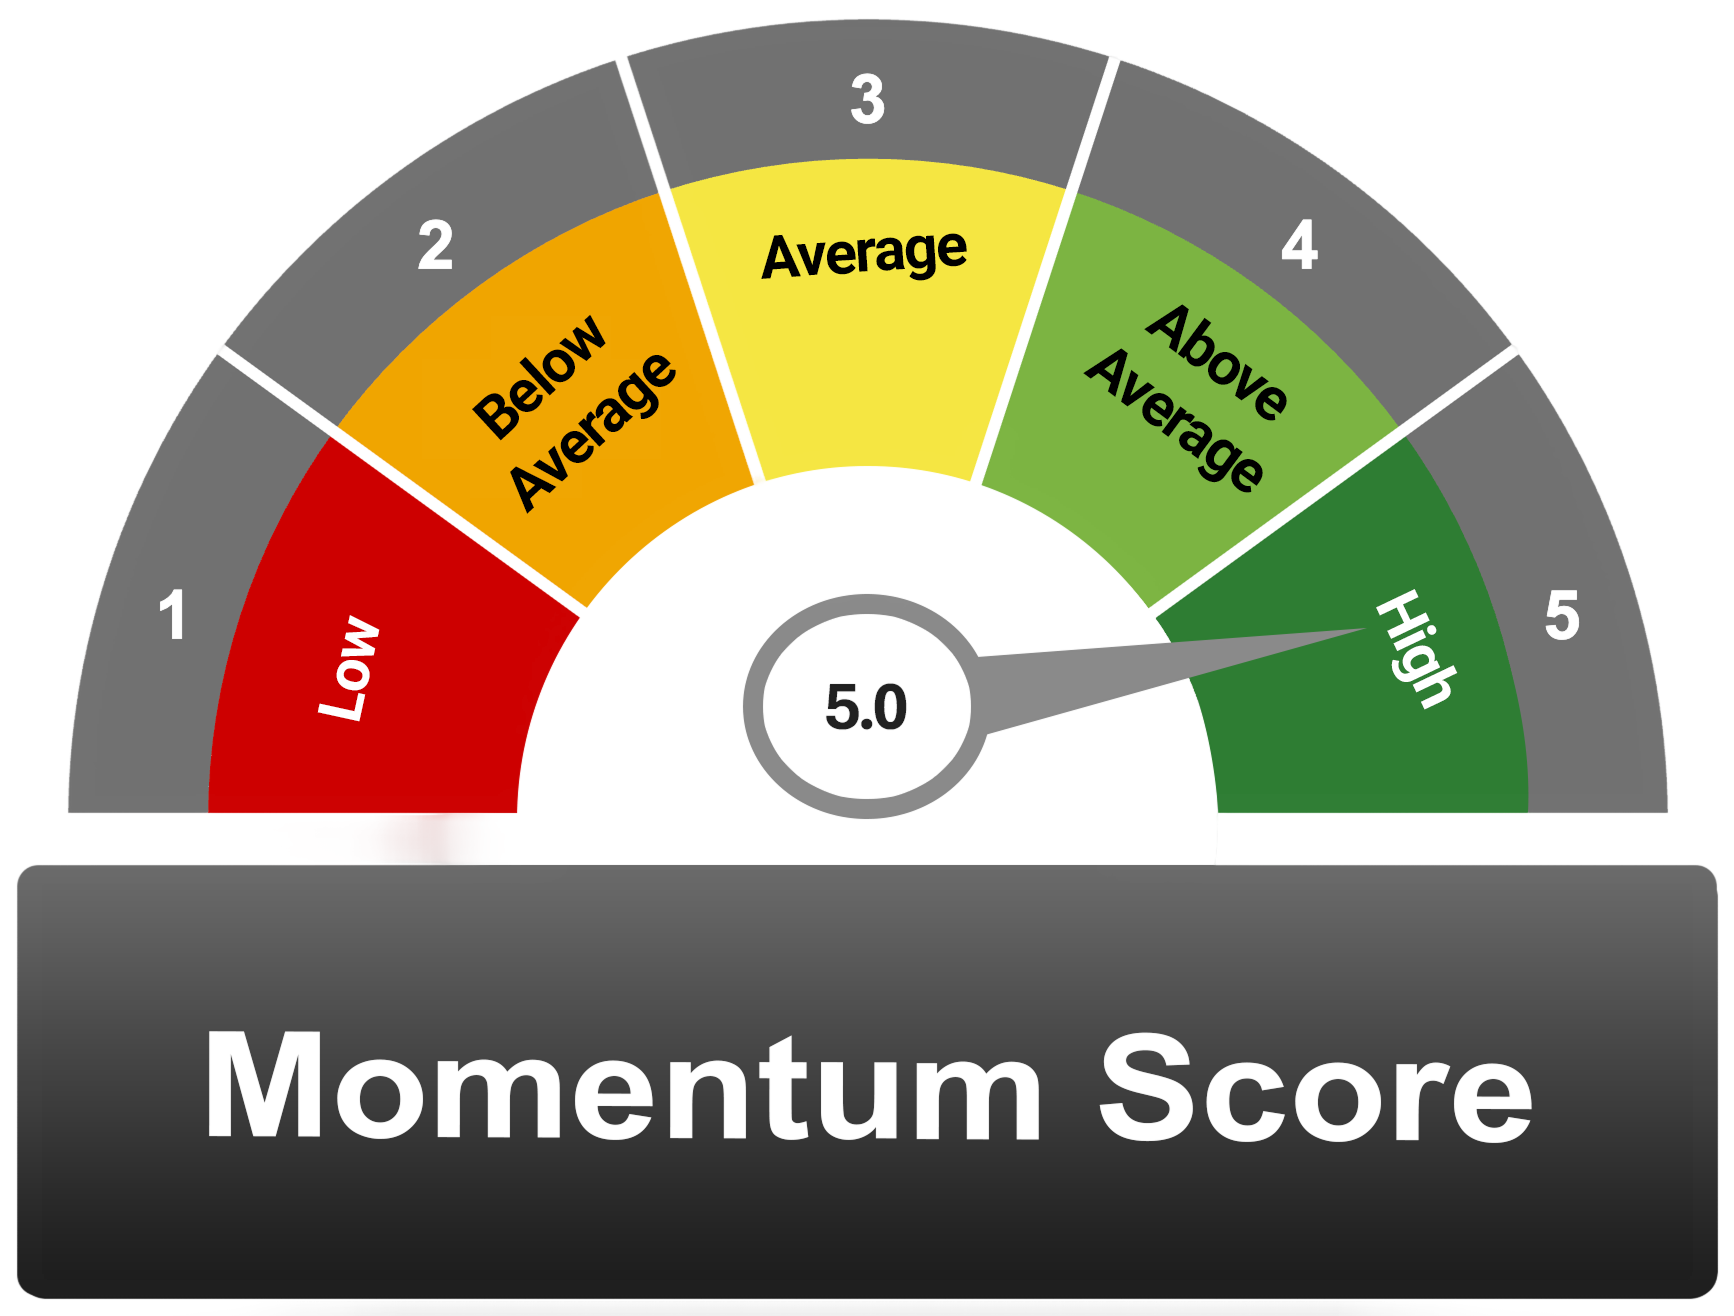
Data Source: REFINITIV, Analysis: Kalkine Group; Note: Momentum score is based on certain criteria’s been met for technical indicators such as Relative Strength Index (RSI), Simple Moving Average (SMA), Parabolic SAR, Direction Movement Index (DMI) and MACD Histogram.