
The Ministry of Statistics & Programme Implementation (MoSPI) released the Consumer Price Index (CPI) data on January 12, 2026, indicating that headline inflation stood at 1.33% in December 2025 compared to the same month last year. This marks the fourth consecutive month of subdued inflationary readings.
The figure remains below the Reserve Bank of India’s (RBI) lower tolerance threshold, reflecting continued moderation in overall price levels. The data points to limited demand-side pressures across major consumption categories during the month under review.
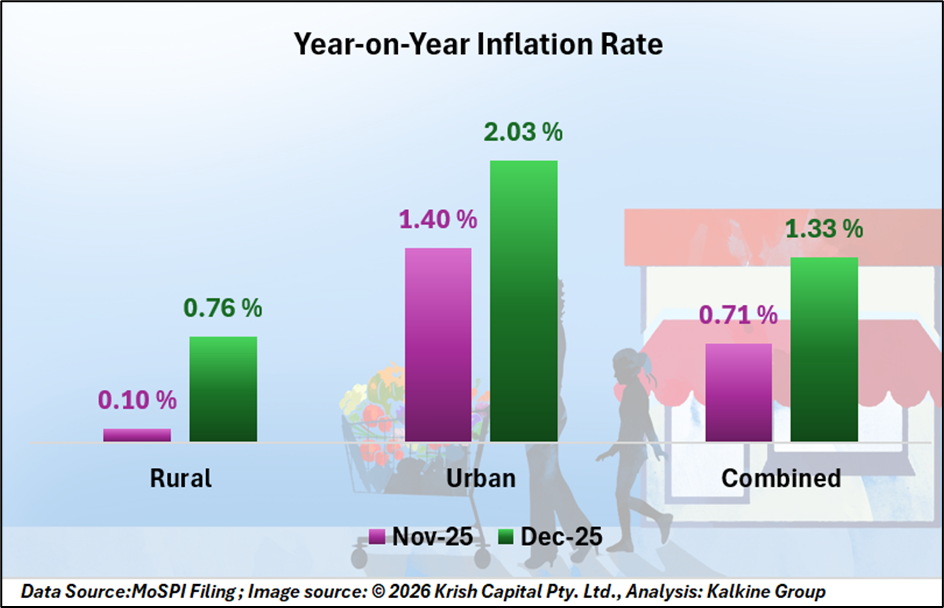
Rural and Urban Inflation Trends Diverge
Inflation patterns varied between rural and urban regions. In rural areas, headline CPI rose to 0.76% in December from 0.10% in November 2025, suggesting a marginal increase in price levels.
Urban inflation moved higher to 2.03%, up from 1.40% in the previous month. The increase was largely attributed to higher costs in housing, education, and transport services. Despite these movements, both rural and urban segments continued to register negative food inflation during the period.
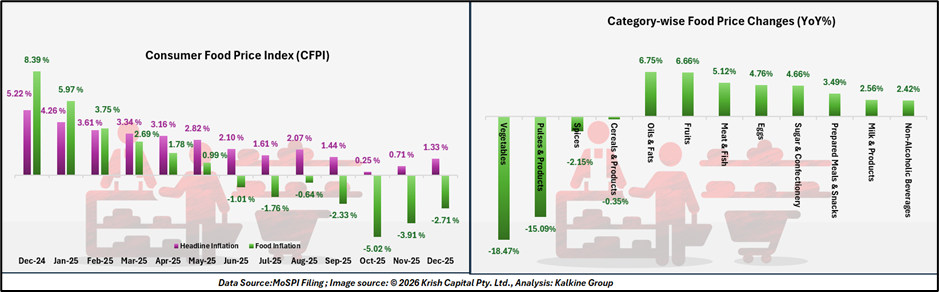
Food Prices Continue to Decline
A notable component of the December data was the ongoing contraction in food inflation. The Consumer Food Price Index (CFPI) recorded –2.71% year-on-year inflation. Lower prices across vegetables and essential staples contributed significantly to the decline.
The persistence of negative food inflation has been a key factor in keeping the headline number low. Given the weight of food items in household expenditure, particularly in rural areas, the decline has had a measurable impact on aggregate inflation trends.
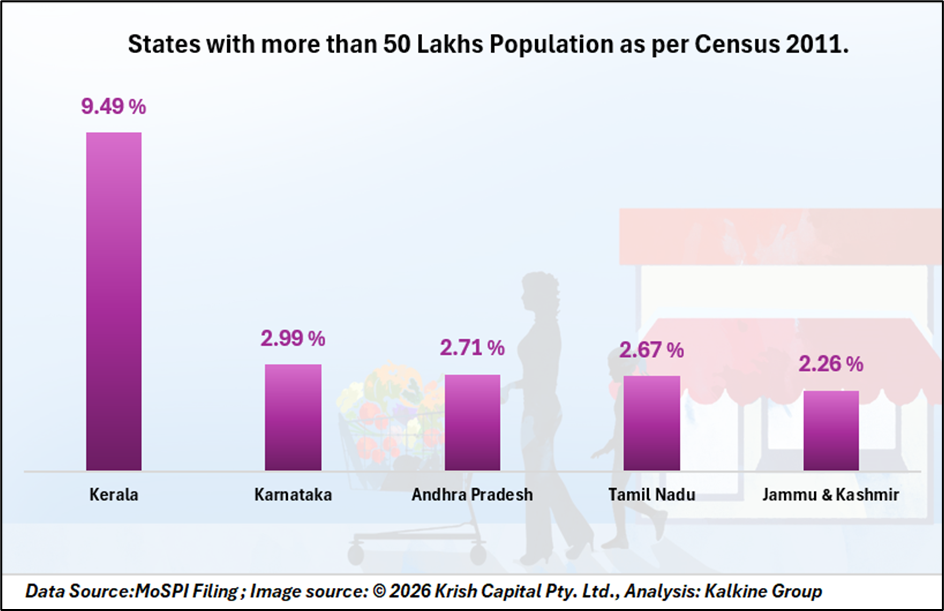
Top five major states with high Year on Year inflation
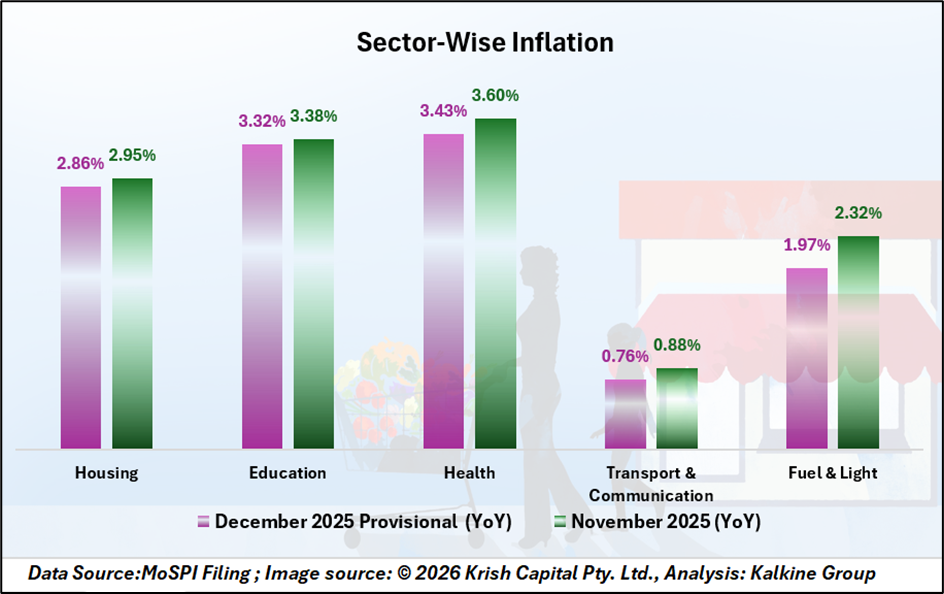
Category-Wise Movements: Services Edge Higher
Among key expenditure groups, housing inflation stood at 2.86%, reflecting changes in rental and associated housing costs. Education inflation was recorded at 3.32%, while health inflation came in at 3.43%. These segments indicated moderate price increases compared to essential goods.
The divergence between service-related inflation and food price deflation underscores varying dynamics within the consumption basket. While essential commodities showed price softness, service categories recorded comparatively higher inflation rates.
Inflation Trajectory: Stability with Sectoral Gaps
December 2025 CPI data reflects a continued phase of low headline inflation, primarily influenced by sustained food price deflation. While essential goods remained under price pressure, service-oriented categories such as housing, education, and health recorded moderate increases, particularly in urban areas.
The divergence between food and services inflation highlights uneven price movements within the consumption basket. With headline inflation staying below the RBI’s lower tolerance band, overall price conditions remain subdued. Upcoming inflation prints will depend on seasonal trends, agricultural supply dynamics, and shifts in global commodity markets during early 2026.