
Highlights
- Bitcoin traded near USD 64,744, down 42.99% over six months despite a daily gain.
- Ether rose 4.31% on the day but remains 47.35% lower over six months.
- Global crypto market capitalisation stood at USD 2.29 trillion, with equity indices posting declines of up to 5.79%.
Bitcoin (BTC) slipped to the USD 65,000 level recently (during Asain trading hours on 6 February 2026), reversing earlier gains as the broader cryptocurrency market moved lower. The pullback came amid continued volatility across global financial markets, with investors tracking developments in equities, commodities, and macroeconomic indicators.
Bitcoin Retreats to USD 65,000
Bitcoin was trading at approximately USD 64,744, down 42.99% over the past six months. BTC continued to face pressure compared with levels seen earlier in the year.
The price movement occurred amid heightened intraday volatility, with Bitcoin fluctuating around the mid-USD 60,000 range. BTC remains the largest cryptocurrency by market value and continues to account for a dominant share of total digital asset trading volumes.
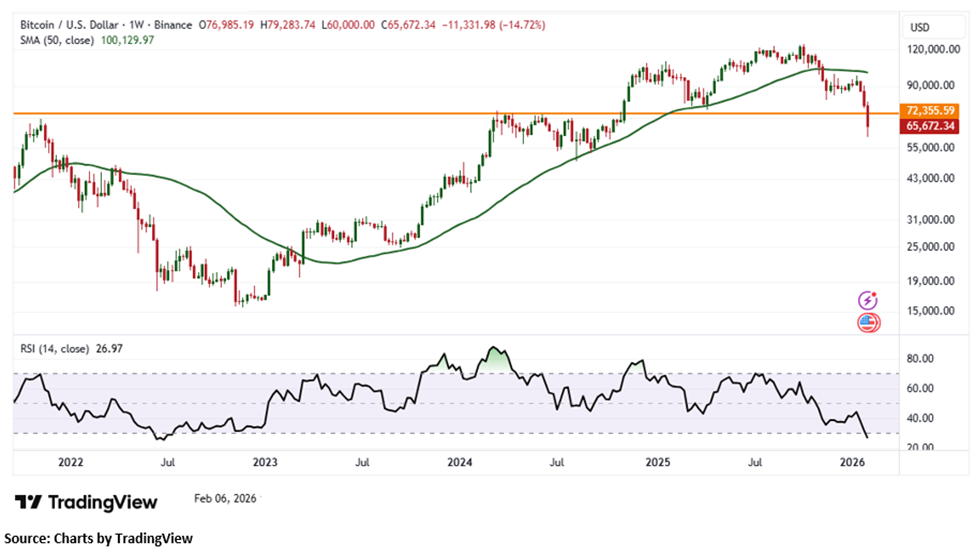
On the weekly chart, Bitcoin is trading below its horizontal trendline support, signaling a bearish shift in momentum and reinforcing a negative near-term bias. The 14-period RSI stands at 26.97, reflecting weakening momentum and indicating oversold conditions, which could allow for short-term volatility or a technical bounce, although downside risks remain elevated. Price action continues to trade below the 50-period Simple Moving Average, which is now acting as a dynamic resistance zone and limiting recovery attempts. The MACD histogram remains below the centerline, confirming the prevailing bearish sentiment, while BTC’s position below the Parabolic SAR further underscores the likelihood of continued downward pressure in the immediate term. On the downside, crucial support is located near the USD 55,200 level, where buyers may attempt to defend the trend. On the upside, resistance is seen around the USD 72,355, and a sustained breakout above this level could spark renewed buying interest and improve the broader short-term outlook.
BTC Chart:
Ether Tracks Bitcoin’s Price Movement
Ether was last recorded near USD 1,901, remaining down 47.35% over the past six months, indicating prolonged weakness relative to previous highs.
ETH’s price action largely mirrored Bitcoin’s movement, with both assets responding to broader market conditions rather than asset-specific developments.
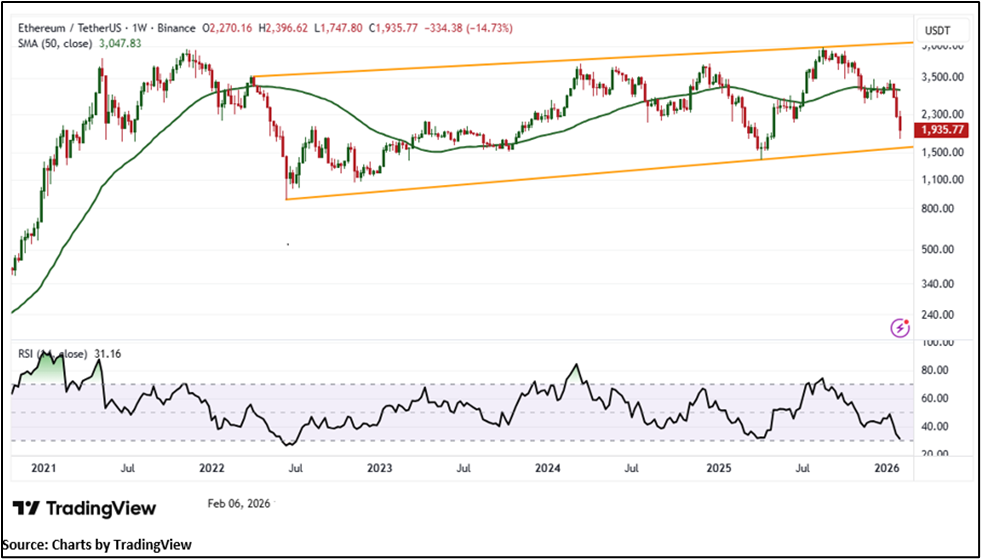
Ethereum is currently trading within a rising channel pattern, with price holding above the lower band near USD 1,590, a historically significant level that has repeatedly limited downside pressure. This suggests that the broader structural trend remains intact despite recent weakness. Momentum indicators highlight oversold conditions, with the 14-period RSI at 31.09, indicating selling pressure may be nearing exhaustion and raising the possibility of a short-term stabilization or bounce. However, ETH continues to trade below its 21-period Simple Moving Average, which is acting as a dynamic resistance level and capping near-term upside attempts. The MACD line remains below the zero line, confirming that negative momentum persists for now. On the downside, sustained weakness below USD 1,590 would increase the risk of a deeper pullback. On the upside, resistance is located near USD 2,250, and a decisive breakout above this level could attract renewed buying interest and improve the broader short-term outlook.
ETH Chart:
Crypto Market Capitalisation Slips
As per CoinGecko data, the global cryptocurrency market capitalisation stood at approximately USD 2.29 trillion, marking a 7.5% change over the last 24 hours. Large-cap cryptocurrencies, including BTC and ETH, were the primary drivers of overall market movement.
Altcoins showed mixed performance, with some tokens posting marginal gains while others extended losses in line with broader crypto trends.
Equity Markets Show Broad Declines
The pullback in digital assets coincided with declines across major global equity indices:
- Dow Jones Industrial Average fell 592.58 points (−1.20%) to 48,908.72.
- Nasdaq Composite declined 363.99 points (−1.59%) to 22,540.59.
- Dow Jones Global Technology Index dropped 70.01 points (−1.64%) to 4,197.52.
- Dow Jones U.S. Mining Index slid 15.22 points (−5.79%) to 247.71.
- NASDAQ-100 Technology Sector Index fell 268.91 points (−2.19%) to 12,016.88.
The declines across equity and sector-specific indices contributed to reduced risk appetite across markets.
Bitcoin’s move down to the USD 65,000 level occurred alongside continued weakness in global equity markets and technology-focused indices. With BTC and ETH remaining closely linked to broader market sentiment, price movements across digital assets continue to track shifts in global risk conditions.
FAQs
Why did Bitcoin move to USD 65,000?
Bitcoin declined amid ongoing volatility across cryptocurrency markets and broader weakness in global equities.
How did ETH perform compared with BTC?
Ether rose 4.31% on the day to around USD 1,901, but remains down 47.35% over six months, similar to BTC’s longer-term trend.
What is the current size of the crypto market?
The global cryptocurrency market capitalisation is approximately USD 2.29 trillion, according to CoinGecko.