
- Stock jumps 16.36% to ₹419.00, emerging among top gainers
• Q3 net profit at ₹2,902.00 lakh; steady operational performance
• RSI climbs above 70, indicating stretched near-term momentum
Overview
Cohance Lifesciences Limited (NSE: COHANCE) rallied sharply to ₹419.00, gaining 16.36% and featuring among the top market gainers. The stock has seen a strong breakout move after a prolonged downtrend, supported by rising volumes and improved price structure.
The sharp upward move signals renewed interest, but the pace of the rally also raises the possibility of short-term consolidation as the stock approaches key resistance levels.
Fundamental View
For the quarter ended December 2025, Cohance Lifesciences reported total income of ₹55,071.00 lakh. Profit before tax stood at ₹4,060.00 lakh, while net profit came in at ₹2,902.00 lakh. Earnings per share was ₹0.96.
The company operates in the life sciences and specialty chemicals space, where demand trends remain stable. While financial performance reflects steady operations, there has not been a major recent earnings trigger disclosed, suggesting that the current rally may be driven more by technical factors and positioning rather than fresh fundamental developments.
Additionally, elevated promoter encumbrance levels remain an important factor to monitor from a risk perspective.
Technical View
Technically, COHANCE is trading near ₹419.00 and has decisively moved above its 21-day SMA around ₹340.03, indicating a shift toward a bullish short-term structure.
The stock has broken out of a consolidation range and formed a strong bullish candle, supported by rising volumes. This breakout suggests a potential trend reversal after a prolonged decline phase.
However, momentum indicators are now stretched. The 14-day RSI is around 72.25, indicating overbought conditions. While this reflects strong momentum, it also increases the probability of near-term consolidation or mild pullback before further upside.
The recent move has been sharp, and price action near resistance zones will be crucial in determining whether the rally sustains or pauses.
Key Technical Levels
Immediate support is placed at ₹380.00–₹360.00, which could act as a cushion if the stock sees a pullback.
On the upside, resistance is seen at ₹450.00–₹475.00, where the stock may face supply pressure after the recent surge.
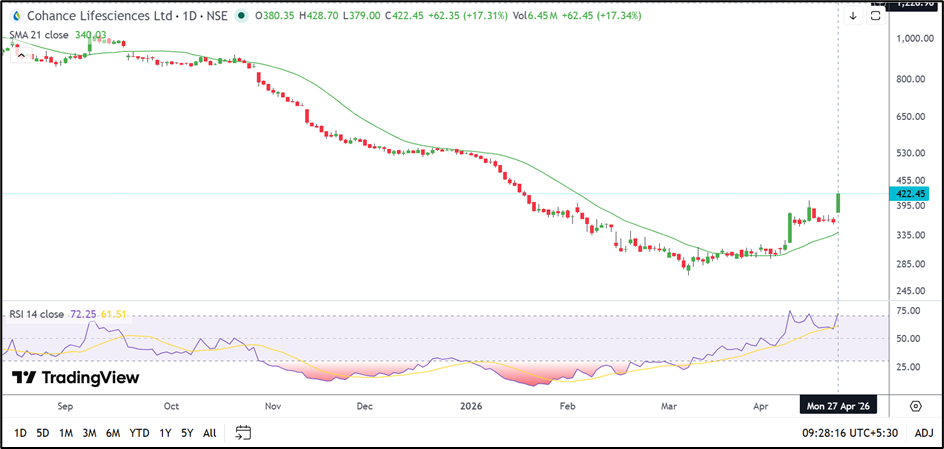
Source: TradingView
Risks To Watch
- Overbought RSI indicating possible short-term pullback
• Elevated promoter share encumbrance
• Lack of fresh fundamental triggers
• Failure to sustain above breakout levels
Summary
Cohance Lifesciences Limited has witnessed a strong breakout rally, supported by improving technical structure and momentum. While the move signals a possible trend reversal, the overbought RSI suggests that the stock may enter a consolidation phase in the near term.
The ₹380.00–₹360.00 support zone will be key for holding gains, while ₹450.00–₹475.00 remains a critical resistance band. Sustained movement above resistance could extend the rally, while rejection may lead to short-term cooling.
FAQs
Why is COHANCE stock rising?
The rally is driven by technical breakout and strong momentum rather than a specific recent fundamental trigger.
Is the stock overbought?
Yes, RSI above 70 indicates overbought conditions in the short term.
What levels should traders watch?
Support is at ₹380.00–₹360.00, while resistance is at ₹450.00–₹475.00.