
- Stock declines 7.27% to ₹867.85 after sharp rejection from higher levels
• Q4 net profit at ₹3,820.00 lakh; revenue remains stable
• RSI weakens below signal line, indicating fading momentum
Overview
Cyient Limited (NSE: CYIENT) slipped to ₹867.85, falling 7.27% following its latest quarterly results. The stock faced strong rejection near ₹937.00, reversing recent gains and indicating a shift in near-term sentiment.
Despite reporting stable financial performance, the price action suggests that expectations may have already been priced in. The sharp pullback highlights caution among market participants, with the stock now drifting back toward key support levels.
Fundamental View
For the quarter ended March 2026, Cyient reported total income of ₹63,540.00 lakh. Profit before tax stood at ₹5,090.00 lakh, while net profit came in at ₹3,820.00 lakh. Earnings per share was ₹3.46.
The company continues to benefit from steady demand in engineering, design, and technology services. However, the absence of a sharp earnings surprise appears to have limited upside traction. Margins and profitability remain stable, but growth visibility may not be strong enough to sustain recent price gains.
Overall, the fundamental setup remains steady, though not strong enough to immediately drive fresh upside momentum.
Technical View
Cyient is currently trading near ₹867.85 and has slipped below its 21-day SMA around ₹871.10, indicating a weakening short-term structure. The recent bearish candle reflects strong selling pressure after a failed breakout attempt.
The stock had earlier shown signs of recovery from lower levels but failed to hold above the ₹925.00 zone. This rejection suggests supply pressure remains active at higher levels, preventing sustained upside continuation.
Momentum indicators are also turning negative. The 14-day RSI has dropped to around 44.03 and moved below its signal line, indicating that momentum is weakening and the stock may enter a consolidation or further corrective phase.
Key Technical Levels
The stock is now approaching a support zone of ₹810.00–₹770.00, which could act as a near-term cushion if selling pressure continues.
On the upside, resistance is placed at ₹925.00–₹1,000.00. Any recovery attempts may face pressure within this zone unless momentum improves.
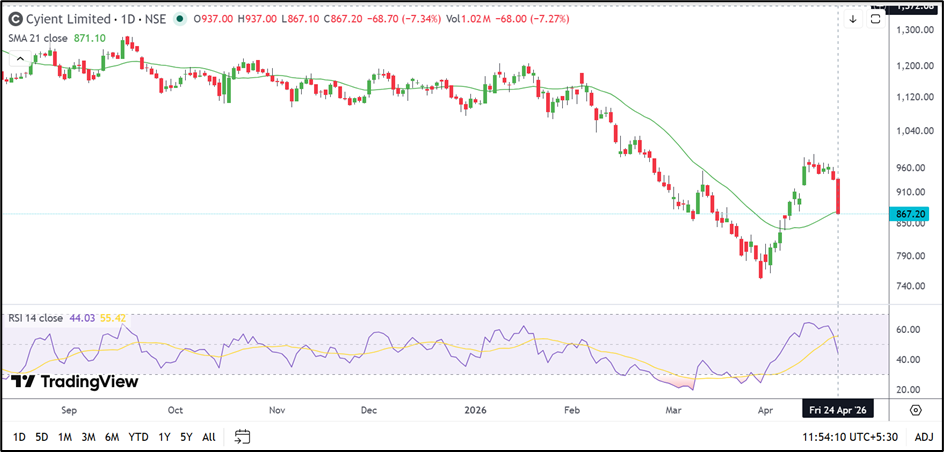
Source: TradingView
Risks To Watch
- Sustained trading below the 21-day SMA
• Lack of strong earnings acceleration
• Continued weakness in IT sector sentiment
• Breakdown below key support levels
Summary
Cyient Limited has entered a corrective phase after failing to sustain its recent upward move. While fundamentals remain stable, the technical setup indicates fading momentum and increasing downside risk in the short term.
The ₹810.00–₹770.00 support zone will be critical in determining whether the stock stabilizes or extends its decline. Until a clear reversal signal emerges, the price may remain under pressure with phases of consolidation.
FAQs
Why did CYIENT fall after Q4 results?
The decline reflects technical rejection near resistance and absence of a strong earnings surprise.
Is the stock trend turning negative?
Short-term trend has weakened as the stock slipped below its 21-day SMA.
What are the important levels to watch?
Support is at ₹810.00–₹770.00, while resistance is at ₹925.00–₹1,000.00.