
Highlights
- The stock has risen sharply and crossed the 50-day SMA, indicating improving short-term price structure.
- Momentum indicators show strengthening trend, with RSI nearing overbought levels after recent rally.
- Key resistance lies ahead, suggesting potential consolidation following the sharp upward movement.
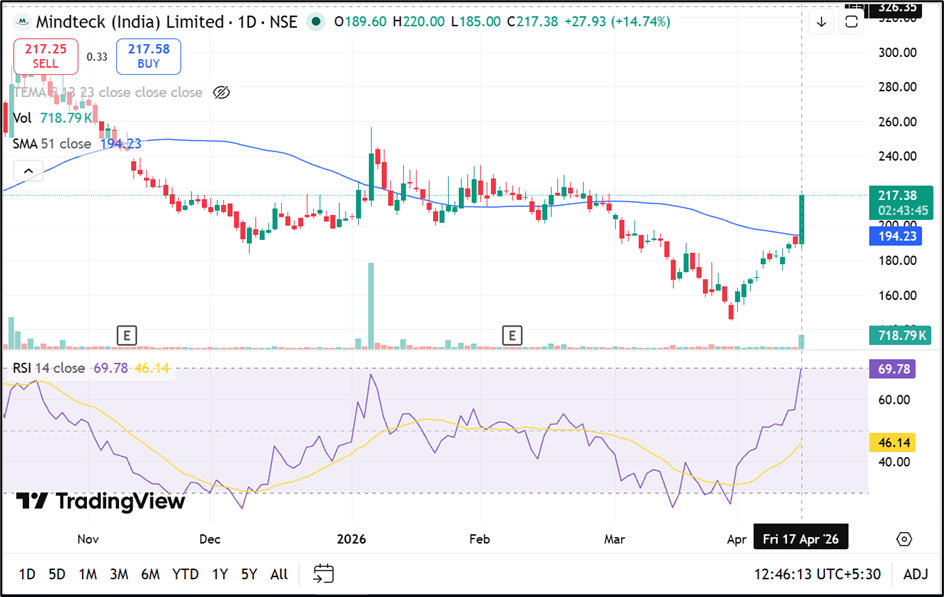
Mindteck (India) Limited (NSE:MINDTECK) is currently trading near INR 217.38, reflecting a gain of around 14.74% in the latest session. The stock has moved above its 50-day simple moving average at INR 194.23, indicating a shift from a prior downtrend toward a recovery phase.
The recent price movement suggests that buyers have returned after a prolonged decline, with the stock rebounding from its 52-week low of INR 145.13 recorded in March 2026.
Despite this upward move, the stock is approaching a resistance band between INR 230.00 and INR 250.00. This zone could act as a near-term barrier, potentially leading to consolidation or minor pullbacks before any sustained directional move. Immediate support is seen in the INR 200.00–185.00 range, which may cushion downside volatility if profit booking emerges.
Momentum Indicators Reflect Strengthening Trend
The 14-day Relative Strength Index (RSI) stands near 69.78, indicating improving momentum and nearing overbought territory. This suggests that while buying interest remains intact, the pace of gains could moderate in the near term.
The intraday price range between INR 185.00 and INR 220.00 highlights elevated volatility, supported by a daily volatility of 3.58 and annualised volatility of 68.40. The stock’s VWAP at INR 211.39 further reflects that current trading levels are slightly above average traded prices, reinforcing short-term sentiment.
Returns Outperform Benchmark Indices
Mindteck has delivered notable absolute returns across multiple timeframes. Over the past week, the stock gained 19.90% compared to 0.90% in NIFTY 50. On a one-month basis, returns stand at 26.50%, significantly higher than benchmark performance.
Longer-term performance remains elevated, with 3-year returns at 123.17% and 5-year returns at 513.66%, compared to 37.05% and 66.01% respectively for the index. However, year-to-date returns of 6.77% contrast with a decline of 7.19% in NIFTY 50, indicating relative resilience in the current year.
Financial Snapshot Reflects Moderate Profitability
For the quarter ended December 2025, consolidated total income stood at INR 10,268 lakh, with profit before tax at INR 598 lakh and net profit at INR 505 lakh. Earnings per share came in at INR 1.58.
On a standalone basis, total income was INR 4,019 lakh, while net profit stood at INR 217 lakh with EPS of INR 0.68. These figures reflect stable profitability, though not indicative of aggressive earnings expansion.
Technical summary
Mindteck (India) Limited is trading near ₹217.38, up around 14.74%, and has moved above the 50-day SMA near ₹194.23, the 14-day RSI near 69.78 points to strengthening momentum, just below overbought territory. Immediate support is placed in the ₹200.00–185.00 zone, while resistance is seen near the ₹230.00–250.00 range.
Source: TradingView
Key Risks to Monitor
- Sharp price rise may lead to short-term profit booking and volatility.
- Resistance zone between INR 230–250 could restrict further upside.
- High volatility levels may increase downside risk during market corrections.
- RSI nearing overbought territory could signal temporary price exhaustion.
Summary
Mindteck (India) Limited (NSE:MINDTECK) has witnessed a sharp upward move, crossing its 50-day SMA and signaling a shift toward recovery. Momentum indicators suggest strengthening trend conditions, although the stock is nearing resistance levels that may limit immediate upside. While historical returns remain elevated, near-term movement could involve consolidation due to technical and volatility factors.
Frequently Asked Questions (FAQs)
What does crossing the 50-day SMA indicate for Mindteck stock?
Crossing the 50-day SMA suggests a shift in short-term trend, indicating potential recovery from earlier weakness.
Why is RSI near 70 considered important for the stock?
RSI near 70 indicates strong momentum but also signals that the stock may approach overbought conditions.
What are the key support and resistance levels currently?
Immediate support lies between INR 200–185, while resistance is observed in the INR 230–250 range.