
- Stock jumps 7.13% to ₹315.40 amid strong Q4 performance
• Net profit stands at ₹94,048.00 lakh; income at ₹5,55,952.00 lakh
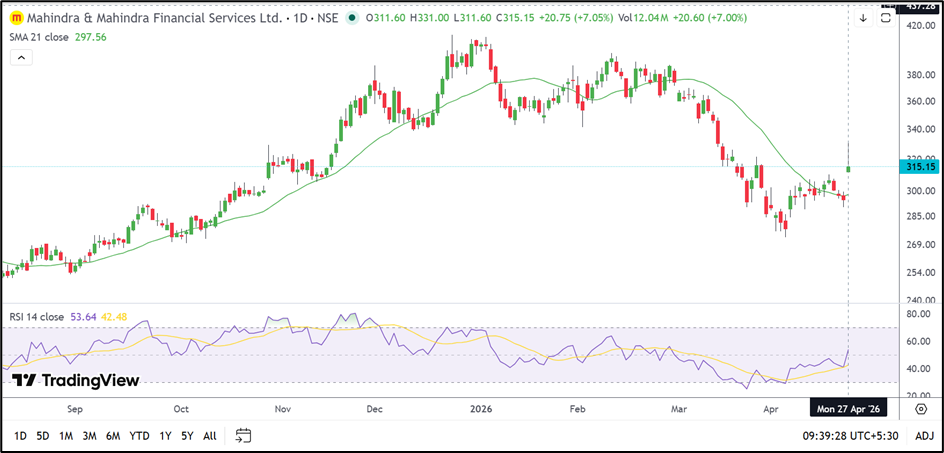
• RSI improves, signaling recovery in short-term momentum
Overview
Mahindra & Mahindra Financial Services Limited (NSE: M&MFIN) climbed to ₹315.40, gaining 7.13%, as the stock staged a notable rebound following its Q4 FY26 results. The move comes after a recent corrective phase, indicating a shift in near-term price behavior.
The stock has recovered from lower levels and is attempting to stabilize above key moving averages, suggesting that the recent downside pressure may be easing. The sharp bounce also reflects improved sentiment around the company’s latest earnings performance.
Fundamental View
For the quarter ended March 2026, the company reported total income of ₹5,55,952.00 lakh. Profit before tax came in at ₹1,24,300.00 lakh, while net profit stood at ₹94,048.00 lakh. Earnings per share was ₹6.75.
The performance reflects stable growth in lending operations, supported by rural and semi-urban demand trends. Asset quality and disbursement trends remain key factors influencing investor outlook, especially in the NBFC space.
The strong profitability numbers appear to have supported the recent recovery in the stock, though broader sector dynamics and credit cycle trends will continue to play an important role.
Technical View
Technically, M&MFIN is trading near ₹315.40 and has moved above its 21-day SMA around ₹297.56, indicating an improvement in short-term structure.
The stock has formed a strong bullish candle after a decline, suggesting a rebound phase is underway. Price action shows recovery from recent lows, with the stock attempting to build a higher base.
Momentum indicators are also improving. The 14-day RSI is around 53.64 and has moved above its signal line, indicating strengthening momentum after a weak phase.
However, the stock is still trading below its previous swing highs, suggesting that while recovery is visible, the broader structure remains in a rebuilding phase.
Key Technical Levels
Immediate support is placed at ₹280.00–₹255.00, which may act as a cushion in case of renewed weakness.
On the upside, resistance is seen at ₹340.00–₹380.00, where the stock could face selling pressure during further recovery attempts.
Source: TradingView
Risks To Watch
- Volatility in NBFC sector sentiment
• Asset quality and credit cost trends
• Failure to sustain above short-term averages
• Resistance near higher levels limiting upside
Summary
Mahindra & Mahindra Financial Services Limited has shown a sharp rebound following its Q4 results, supported by solid profitability and improving technical indicators.
The stock is currently in a recovery phase, with momentum turning positive. Sustaining above ₹297.56 will be important for maintaining the improving structure, while the ₹340.00–₹380.00 zone remains a key hurdle for further upside.
FAQs
Why did M&MFIN stock rise?
The stock moved higher after Q4 results and improving near-term sentiment.
Is the trend turning positive?
Momentum is improving, but the stock is still in a recovery phase rather than a confirmed uptrend.
What levels should investors track?
Support lies at ₹280.00–₹255.00, while resistance is at ₹340.00–₹380.00.