
- Stock jumps 13.44% to ₹551.10 following Q4 results
• Net profit at ₹388.78 lakh; revenue at ₹22,614.95 lakh
• Momentum strengthens with RSI moving above 70
Overview
Tanla Platforms Limited (NSE: TANLA) surged sharply to ₹551.10, gaining 13.44%, placing the stock among the top gainers. The move comes after the company announced its Q4 FY26 results, which appear to have triggered renewed interest.
The stock has seen a strong upward move after a prolonged period of weakness, indicating a shift in near-term sentiment. The sharp rise suggests that market participants are reacting positively to earnings visibility, though the pace of the move also raises the possibility of near-term consolidation.
Fundamental View
For the quarter ended March 2026, Tanla Platforms reported total income of ₹22,614.95 lakh. Profit before tax stood at ₹652.42 lakh, while net profit came in at ₹388.78 lakh. Earnings per share was ₹0.29.
The company operates in the CPaaS (Communications Platform as a Service) segment, benefiting from increasing enterprise messaging demand and digital communication trends. While the reported numbers indicate stable operations, growth appears measured rather than aggressive.
The recent stock reaction suggests that expectations were relatively low, and even steady performance has acted as a trigger for price re-rating in the short term.
Technical View
Technically, TANLA is trading near ₹551.10 and has moved decisively above its 21-day SMA around ₹458.05, indicating a strong improvement in short-term structure.
The stock has formed a strong bullish candle, reflecting aggressive upward movement supported by rising volumes. This indicates a shift from a corrective phase to a potential recovery trend.
Momentum indicators have strengthened significantly. The 14-day RSI is around 71.35, suggesting elevated momentum levels. While this reflects strength, it also indicates that the stock is entering a stretched zone in the short term.
The sharp vertical move suggests that the stock may either consolidate at higher levels or see intermittent pullbacks before any sustained continuation.
Key Technical Levels
Immediate support is placed at ₹509.00–₹480.00, which could act as a near-term cushion if the stock sees a pullback.
On the upside, resistance is seen at ₹600.00–₹645.00, where the stock may face supply pressure.
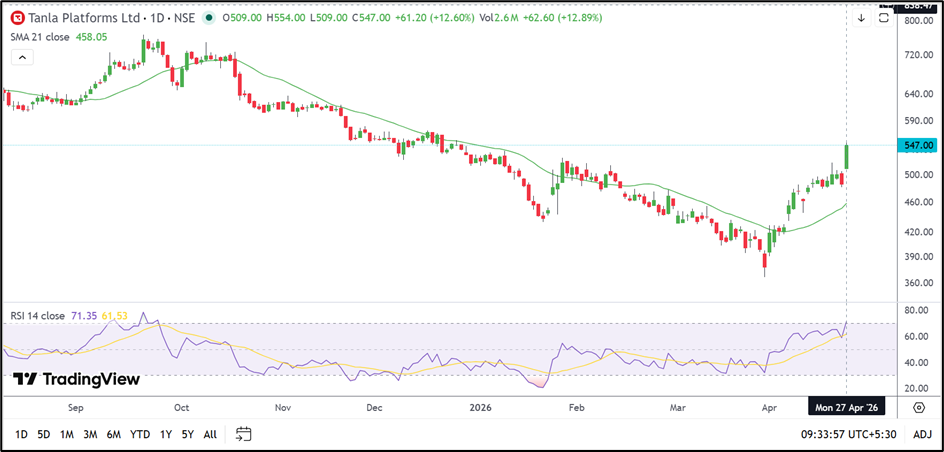
Source: TradingView
Risks To Watch
- RSI in elevated zone indicating possible short-term cooling
• Failure to sustain above recent breakout levels
• Moderate earnings growth trajectory
• Broader tech sector sentiment
Summary
Tanla Platforms Limited has witnessed a sharp upward move following its Q4 results, signaling a shift in near-term sentiment. While the technical structure has improved, the pace of the rally suggests that the stock may enter a consolidation phase.
The ₹509.00–₹480.00 support zone will be critical in maintaining the current structure, while ₹600.00–₹645.00 remains a key resistance band. Sustained strength above resistance could extend the rally, while rejection may lead to short-term cooling.
FAQs
Why is TANLA stock rising?
The rally follows Q4 results and improved sentiment after a period of weakness.
Is the stock overextended?
RSI above 70 suggests the stock is in a high momentum zone, which may lead to consolidation.
What levels should traders watch?
Support is at ₹509.00–₹480.00, while resistance is at ₹600.00–₹645.00.