
- Stock declines to ₹940.35 after sharp rejection from higher levels
• Net loss of ₹5,144.00 lakh weighs on sentiment
• Price slips below 21-day SMA, indicating weakening structure
Overview
UTI Asset Management (NSE: UTIAMC) fell 9.20% to ₹940.35, reflecting a sharp decline following its latest earnings update. The stock has reversed from recent highs near ₹1,065.00 and is now showing signs of renewed weakness.
The decline appears to be driven by earnings disappointment and a shift in short-term sentiment, as price action failed to sustain above key levels.
Fundamental View
For the quarter ended March 2026, the company reported total income of ₹40,205.00 lakh. However, profitability remained under pressure, with a loss before tax of ₹-1,680.00 lakh and a net loss of ₹-5,144.00 lakh. Earnings per share stood at ₹-5.19.
The weak earnings print may have impacted sentiment, particularly in a sector where consistency in profitability is closely tracked. The absence of near-term earnings visibility could keep the stock under pressure.
Technical View
Technically, UTIAMC has witnessed a sharp rejection after attempting a recovery, forming a strong bearish candle on the daily chart. The stock has now slipped below its 21-day SMA near ₹973.87, indicating weakening short-term structure.
The price action suggests a failed breakout attempt, with sellers regaining control near higher levels. The recent decline also breaks the short-term upward swing, shifting the structure toward consolidation with a negative bias.
Momentum indicators reflect deterioration, with RSI slipping to around 42.04 and moving below its signal line. This indicates fading momentum rather than oversold conditions, leaving room for further consolidation.
Key Technical Levels
The stock is approaching a support zone of ₹900.00–₹860.00, which may act as a near-term base if selling pressure stabilizes.
On the upside, resistance is placed at ₹1,000.00–₹1,065.00, where recovery attempts could face supply pressure.
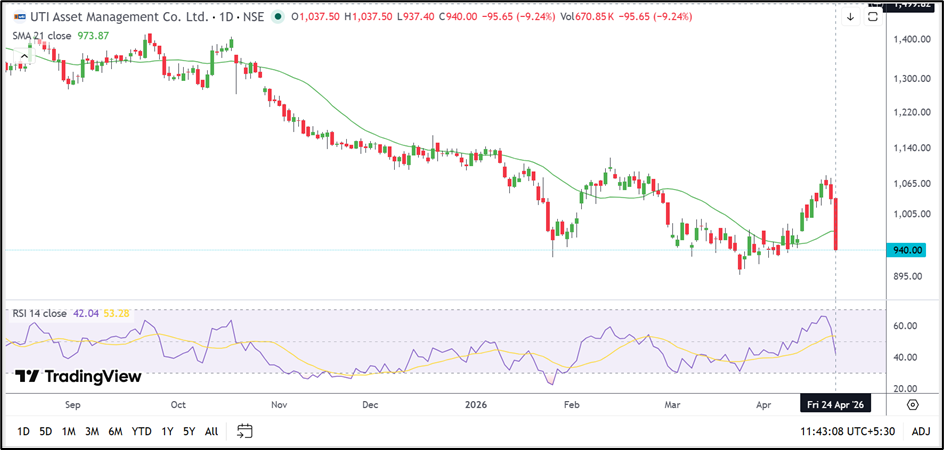
Source: TradingView
Risks To Watch
- Continued earnings weakness and loss-making quarter
• Breakdown below short-term moving averages
• Sector sensitivity to market sentiment
• Volatility near key support levels
Summary
UTI Asset Management has come under pressure following weak earnings and a technical rejection near recent highs. The stock has slipped below key averages, indicating a shift in short-term structure.
While the stock is not yet oversold, the current setup suggests a consolidation phase with downside risk toward support levels unless momentum improves.
FAQs
Why did UTIAMC fall sharply?
The decline follows weak quarterly results and a technical rejection near resistance levels.
Is the stock oversold now?
No, RSI near 42 suggests weakening momentum but not oversold conditions.
What levels should be tracked?
Support is at ₹900.00–₹860.00, while resistance is at ₹1,000.00–₹1,065.00.