
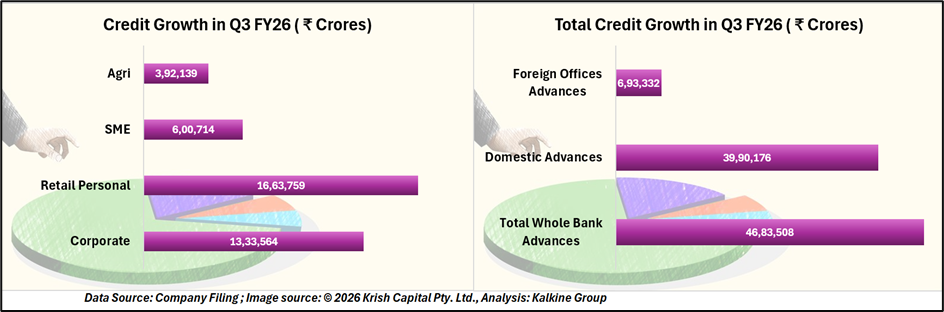
State Bank of India reported total business of over ₹103 trillion in Q3FY26, comprising advances of ₹46.83 trillion and deposits of ₹57.01 trillion. Whole bank advances grew 15.14% year-on-year, driven by demand across domestic and overseas operations. Domestic advances increased 15.44% YoY, while foreign office advances rose 13.41% YoY, led by activity in the US, GIFT City, Middle East, and East Asia.
Segment-wise, the SME portfolio crossed ₹6 lakh crore, recording 21.02% YoY growth. Agriculture advances grew 16.56% YoY, while retail personal loans increased 14.95% YoY, reflecting diversified credit distribution.
Profitability Trends and Earnings Profile
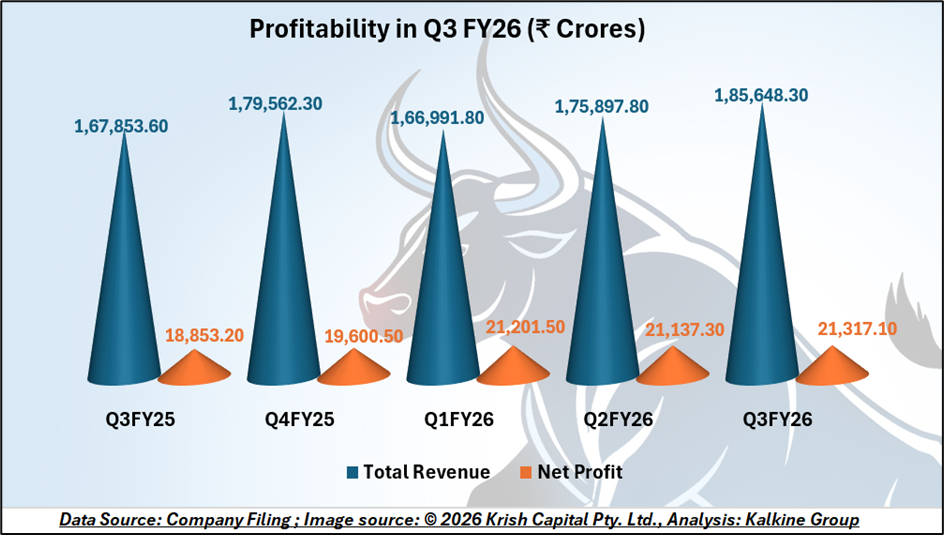
For Q3FY26, the bank posted a net profit of ₹21,028 crore, up 24.49% YoY. Operating profit rose 39.54% YoY to ₹32,862 crore, supported by growth in operating income and controlled expenses. Net Interest Income for the quarter stood at ₹45,190 crore, registering a 9.04% YoY increase.
For the nine-month period ended FY26, net profit increased 15.48% YoY to ₹60,348 crore. Return on Assets improved to 1.16%, while Return on Equity was reported at 20.68%.
Margins, Fees, and Operating Metrics
During the quarter, domestic Net Interest Margin was reported at 3.12%, while whole bank NIM stood at 2.99%. The cost-to-income ratio improved to 48.29%. Non-interest income was supported by a 15.65% YoY increase in fee income, recoveries from AUCA accounts, and treasury-related income.
Deposits and Liability Mix
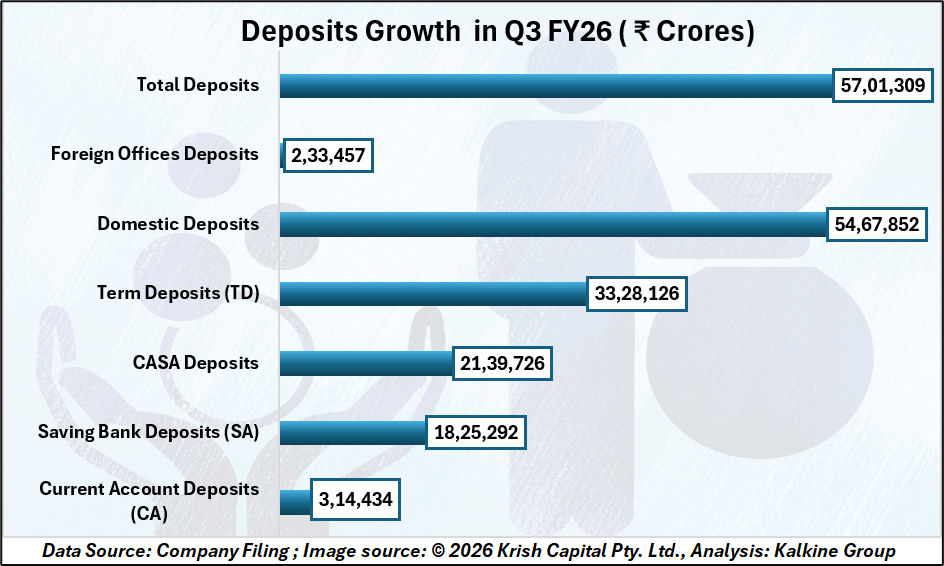
Total deposits rose 9.02% YoY to ₹57.01 trillion. CASA deposits increased 8.88% YoY, with the CASA ratio at 39.13% as of December 31, 2025. Current account balances grew 10.32% YoY, while retail term deposits increased 14.54% YoY.
Asset Quality and Capital Position
Gross NPA declined to 1.57%, while Net NPA stood at 0.39%. Provision Coverage Ratio improved to 75.54%, and PCR including AUCA reached 92.37%. Credit cost for the quarter was 0.29%. Non-NPA provisions amounted to ₹30,642 crore.
Capital Adequacy Ratio stood at 14.04%, with CET-1 at 10.99% and Tier-1 at 12.07%.
Digital and Sustainability Metrics
During 9MFY26, 98.6% of transactions were executed through alternate channels. The YONO platform recorded 9.65 crore registered users, with over 68% of savings accounts opened digitally in Q3FY26. The sustainable finance portfolio crossed ₹1.54 lakh crore, while CSR spending for 9MFY26 stood at ₹616 crore.
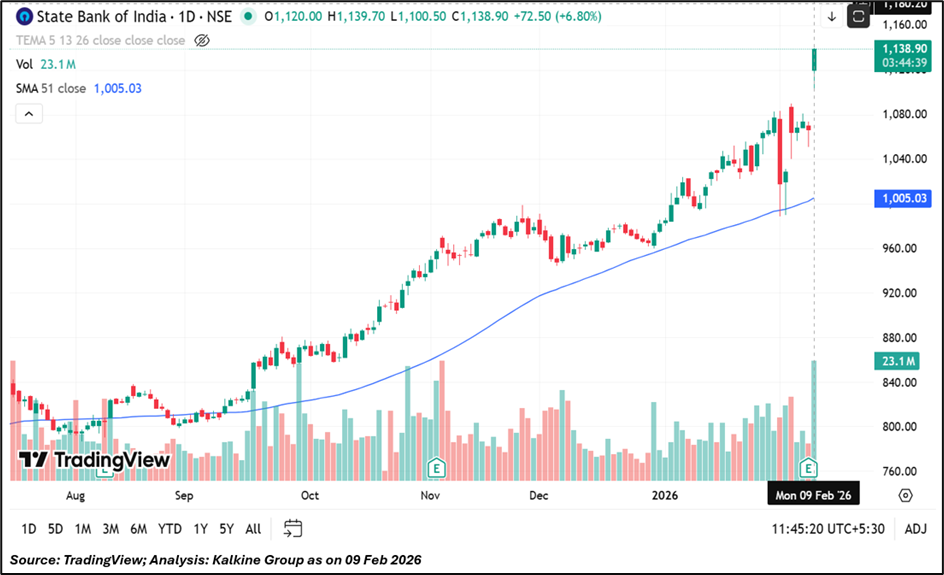
Technical Summary
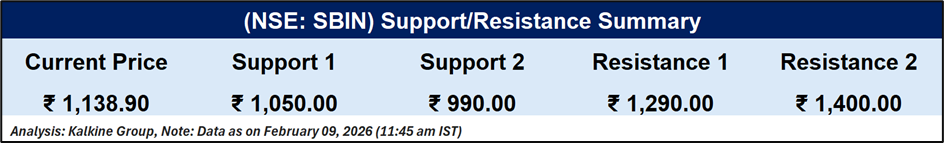
State Bank of India traded at ₹1,138.90 on the daily chart and remains positioned above its 51-day simple moving average near ₹1,005, reflecting sustained price strength relative to the medium-term trend. The broader structure shows a series of higher highs and higher lows over recent months, supported by an increase in trading volumes during the latest session.
On the downside, immediate support is observed near ₹1,050, with a secondary support level around ₹990. On the upside, resistance levels are identified near ₹1,290 and ₹1,400, marking key overhead price zones.
A Strong Finish Backed by Scale and Stability
State Bank of India’s Q3FY26 performance highlights resilient growth, improving profitability, and a stronger balance sheet. Broad-based credit expansion, healthy margins, lower NPAs, and robust capital adequacy underline operational strength. With accelerating digital adoption and rising sustainable finance exposure, SBI remains well-positioned to sustain earnings momentum and navigate future growth opportunities with confidence.