
Indian Markets Slide as Middle East Conflict, Oil Surge, and Currency Moves Weigh on Sentiment
- Benchmark Indices Decline: The Nifty 50 fell 1.32% to 23,326.80, while the Sensex dropped 1.16% to 75,153.61 in early trade.
- Weekly Loss Deepens: Both indices are heading toward their largest weekly drop since December 2024, with losses exceeding 4%.
- Middle East Conflict Escalates: Rising tensions in the Middle East are increasing global uncertainty and pushing investors toward safer assets.
- Brent Crude Jumps: Brent crude climbed near $100 per barrel, raising concerns about inflation and input costs.
- Energy Supply Risks: Potential supply disruptions through the Strait of Hormuz are increasing volatility in global energy markets.
- USD/INR Movement: The Indian rupee weakened against the US dollar, reflecting global risk aversion and stronger dollar demand.
- Auto Stocks Under Pressure: The auto sector declined 1.3%, extending losses amid higher fuel cost concerns.
- Broader Market Weakness: Mid-cap and small-cap indices slipped, indicating cautious positioning across the market.
Nifty 50: The Nifty has entered a technical correction phase, declining more than 11% from its all-time high recorded on January 5. The decline has been largely driven by intense selling from foreign investors, with outflows exceeding ₹32,800 crore in just six sessions, alongside rising crude oil prices that have weighed on overall market sentiment.
Markets Slide as Crude Oil Surge, Weak Global Cues and FII Outflows Weigh on Sentiment
India’s benchmark Nifty 50 index has moved into a short-term bearish phase, declining more than 11% from its January peak of 26,332 and slipping below the 23,500 level by March 13, 2026. The decline has been largely influenced by heavy foreign institutional investor (FII) outflows exceeding ₹32,800 crore in six sessions. Rising Middle East tensions have also increased global uncertainty. Meanwhile, Brent crude near $100 per barrel has raised concerns over inflation and input costs. Possible energy supply disruptions through the Strait of Hormuz and a weaker Indian rupee against the US dollar have further weighed on overall market sentiment
Technical View: Nifty 50 Remains Under Technical Pressure as Downtrend Extends
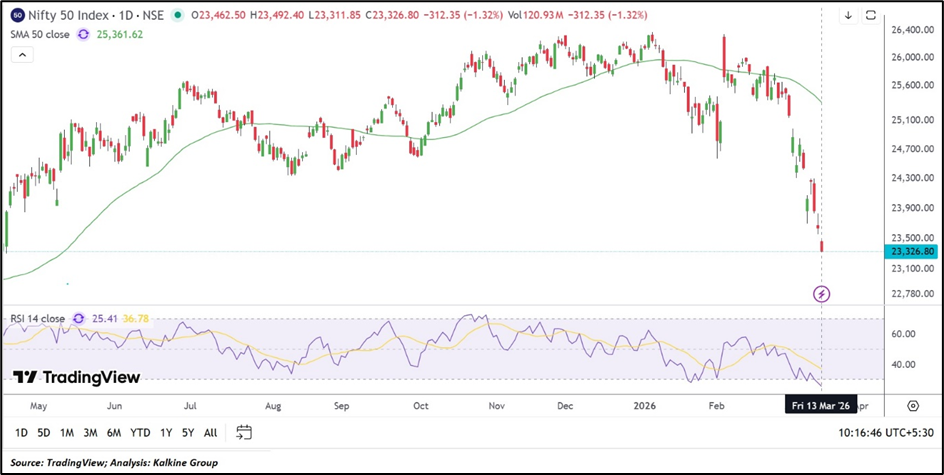
From a technical perspective, the Nifty 50 index fell to around 23,326.80 on March 13, 2026, continuing to trade below its 50-day Simple Moving Average near 25,361.62, which reflects the prevailing downward trend. The price structure shows a sequence of lower highs and lower lows on the daily chart, indicating sustained weakness. Momentum indicators also remain subdued, with the 14-day RSI near 25.41, pointing to oversold conditions after the recent decline. In the near term, support is placed around 22,800.00–22,200.00, while resistance is seen near 24,200.00–24,800.00, which may act as key levels in the short term.
Bottom Line: Nifty at 11-Month Low: Will the Market Stabilise or Extend the Downtrend?
The Nifty 50 remains under pressure after falling to an 11-month low, reflecting cautious sentiment across the market. While oversold indicators may support short-term stabilisation, the near-term direction could depend on crude oil trends, Middle East tensions, and foreign investor flows.