
India’s cumulative exports of merchandise and services during April–January 2025-26 are estimated at US$ 720.76 billion, compared with US$ 679.02 billion in the corresponding period of 2024-25. This represents a growth of 6.15%, reflecting steady expansion in external trade despite global economic uncertainties.
During the same period, total imports rose to US$ 823.41 billion from US$ 772.85 billion, marking a 6.54% increase. Consequently, the overall trade deficit widened to US$ 102.65 billion, compared with US$ 93.83 billion in the previous year.
January 2026 Registers Strong Double-Digit Export Growth
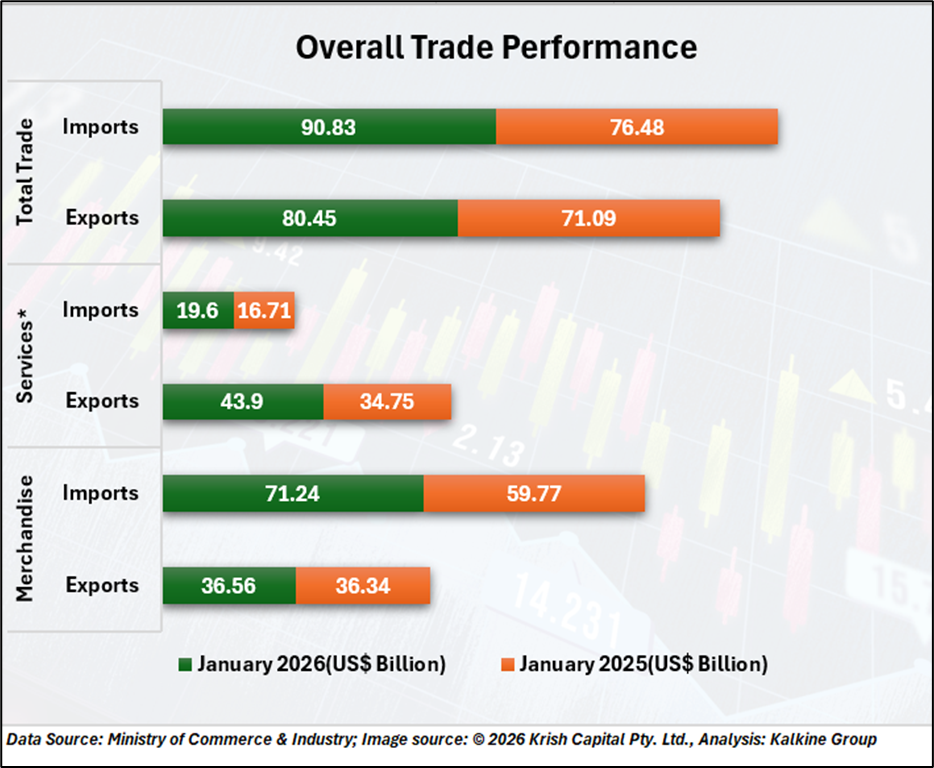
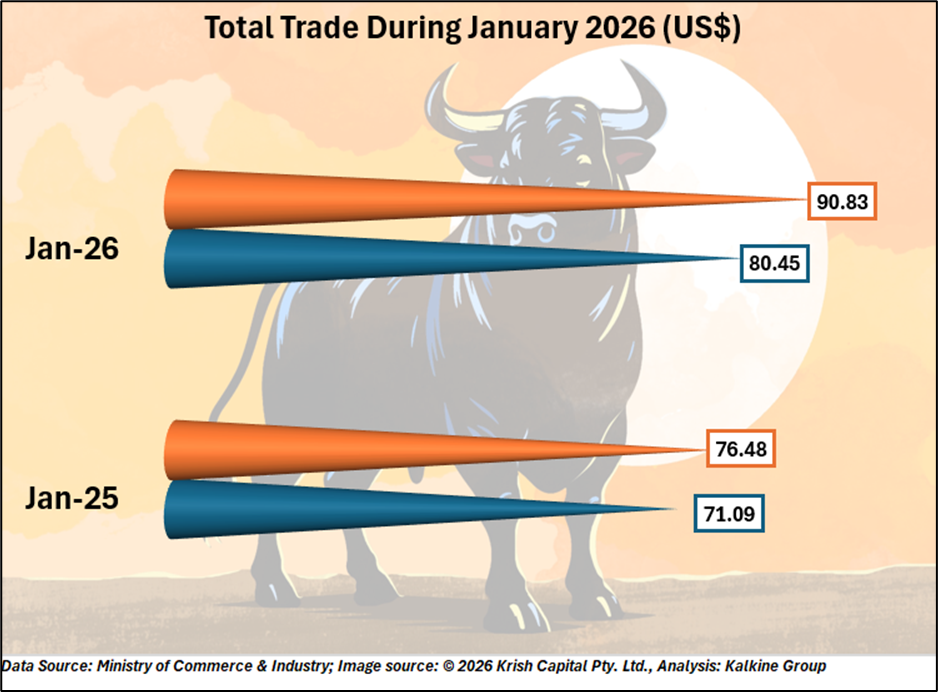
In January 2026, India’s total exports (merchandise and services combined) are estimated at US$ 80.45 billion, registering a robust year-on-year growth of 13.17% compared to US$ 71.09 billion in January 2025. Imports during the month rose more sharply by 18.76% to US$ 90.83 billion, up from US$ 76.48 billion a year earlier.
The trade deficit for January 2026 therefore widened to US$ 10.38 billion, compared with US$ 5.39 billion in the same month last year, indicating faster import growth relative to exports during the month.
Merchandise Trade Records Moderate Growth
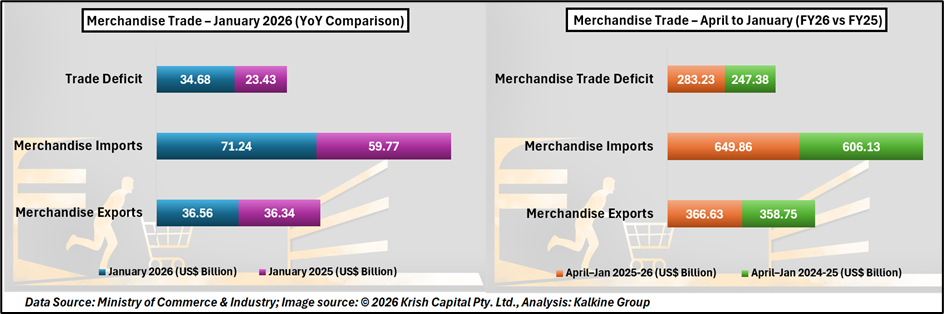
Merchandise exports in January 2026 stood at US$ 36.56 billion, slightly higher than US$ 36.34 billion recorded in January 2025. However, merchandise imports rose significantly to US$ 71.24 billion from US$ 59.77 billion, resulting in a wider merchandise trade gap for the month. For the April–January 2025-26 period, merchandise exports reached US$ 366.63 billion compared to US$ 358.75 billion in the previous fiscal year period, reflecting a positive growth of 2.20%.
Merchandise imports during the same period increased to US$ 649.86 billion from US$ 606.13 billion, pushing the merchandise trade deficit to US$ 283.23 billion, higher than US$ 247.38 billion recorded a year earlier.
Non-Petroleum and Core Exports Show Stronger Momentum
Non-petroleum exports during April–January 2025-26 were valued at US$ 320.94 billion, compared to US$ 305.98 billion in the corresponding period of 2024-25, registering a growth of 4.89%. This indicates relatively stronger performance in segments beyond petroleum-linked trade.
Furthermore, non-petroleum and non-gems & jewellery exports reached US$ 297.41 billion during the period, up from US$ 281.59 billion last year. These figures suggest broader-based export resilience across diversified product categories.
Key Sectors Drive January Export Growth
Several major sectors contributed significantly to merchandise export growth in January 2026. Engineering goods exports increased by 10.37% to US$ 10.40 billion from US$ 9.42 billion in January 2025, continuing to remain one of the largest export segments. Petroleum products exports rose by 8.55% to US$ 3.77 billion.
Agricultural and food-related exports also performed strongly, with meat, dairy and poultry products growing 17.92% to US$ 0.61 billion, while marine products increased 13.29% to US$ 0.61 billion. Iron ore exports recorded a sharp rise of 31.54%, reaching US$ 0.21 billion compared to US$ 0.16 billion a year earlier.
Other categories that recorded positive growth in January 2026 included other cereals, coffee, mica and mineral products, fruits and vegetables, cereal preparations, man-made yarn and fabrics, drugs and pharmaceuticals, and electronic goods. At the same time, certain import categories such as pulses, newsprint, chemical materials, iron and steel, coal and coke, project goods, and transport equipment registered negative growth compared to January 2025.
Services Trade Continues to Provide Strong Cushion
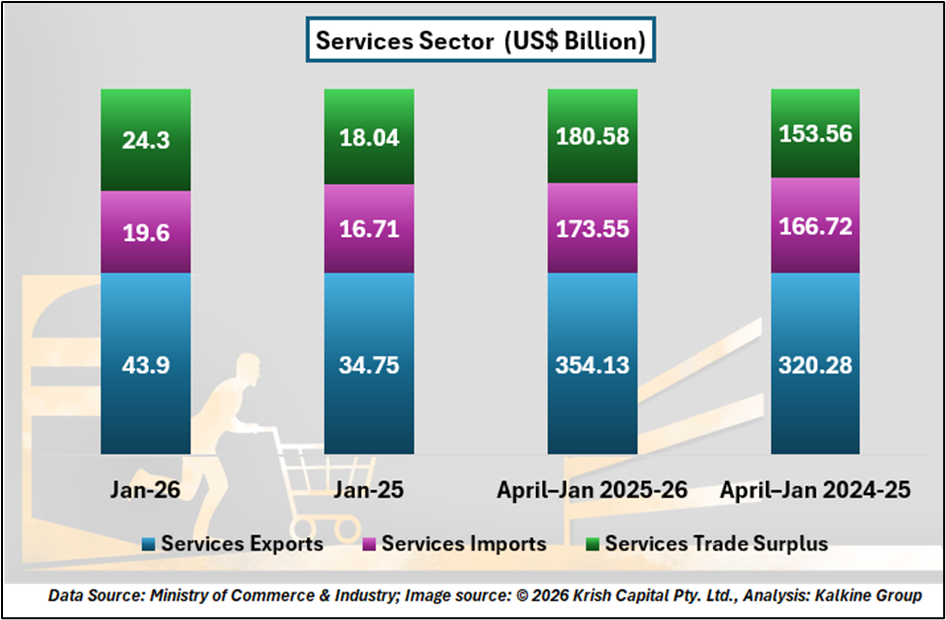
India’s services sector remained a major pillar of trade growth. Services exports for January 2026 are estimated at US$ 43.90 billion, compared to US$ 34.75 billion in January 2025, reflecting strong year-on-year expansion. Services imports during the month stood at US$ 19.60 billion, up from US$ 16.71 billion.
For the April–January 2025-26 period, services exports are estimated at US$ 354.13 billion, compared with US$ 320.28 billion in the corresponding period last year, registering growth of 10.57%. Services imports during this period were US$ 173.55 billion, compared to US$ 166.72 billion previously. As a result, the services trade surplus expanded significantly to US$ 180.58 billion from US$ 153.56 billion, helping offset the widening merchandise trade deficit.
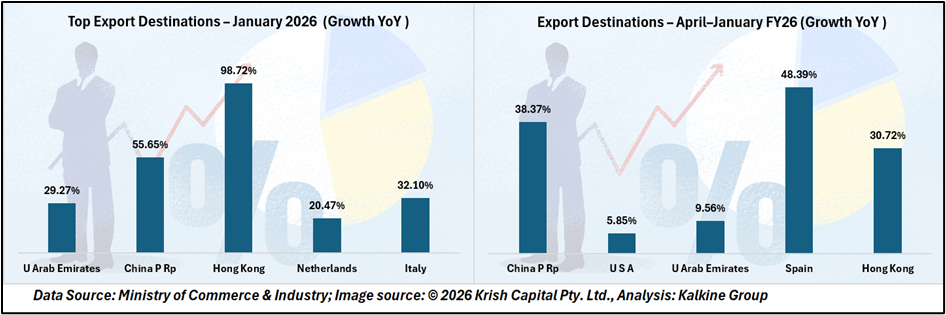
Major Trading Partners Show Positive Growth Trends
Among export destinations showing notable growth in January 2026 were the United Arab Emirates, China, Hong Kong, Netherlands, and Italy. Over the April–January period, exports to China, the United States, the United Arab Emirates, Spain, and Hong Kong recorded positive growth.
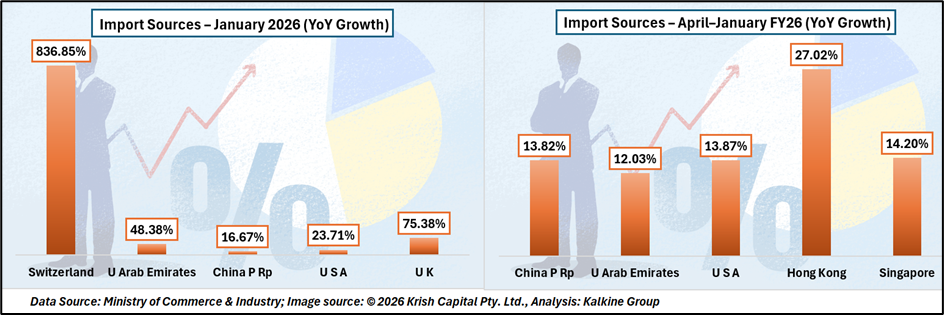
On the import side, strong growth in January 2026 was observed from Switzerland, the United Arab Emirates, China, the United States, and the United Kingdom. For the April–January period, imports from China, the United Arab Emirates, the United States, Hong Kong, and Singapore showed notable increases.
Conclusion: Stable Export Momentum Amid Rising Import Pressures
India’s trade data for April–January 2025-26 reflects steady export growth supported by engineering goods, petroleum products, agricultural exports, and a strong services sector. While the widening trade deficit remains a concern due to rising imports, particularly in merchandise trade, the robust services surplus continues to provide an important cushion.
Sustained growth in diversified export categories and expanding market presence across key trading partners will remain crucial for maintaining external sector stability in the coming months.