
- Stock falls 6.51% to ₹578.50 after recent sideways phase
• Faces supply near ₹600 zone
• Momentum weakens as RSI slips below mid-range
Overview
BlackBuck Limited (NSE: BLACKBUCK) is trading near ₹578.50, down 6.51%, witnessing a sharp decline after struggling to sustain above the ₹600 mark. The stock had been moving in a range recently, but the latest session shows renewed downside pressure.
The fall reflects rejection from a near-term resistance zone.
Fundamental View
For the quarter ended December 2025, the company reported total income of ₹18,827.10 lakh. Profit before tax stood at ₹4,243.00 lakh, while net profit came in at ₹3,172.00 lakh. Earnings per share was ₹1.74.
The financials indicate steady profitability, but price movement suggests short-term market reaction is driven more by technical positioning.
Technical View
Technically, BlackBuck Limited is trading near ₹578.50 and is slightly below its 50-day SMA around ₹592.74, indicating a softer near-term structure.
Price action shows repeated rejection near ₹600–₹615 levels, forming a supply zone. The latest bearish candle signals continuation of range-bound weakness after failing to break higher.
The 14-day RSI is near 45.11 and trending lower, reflecting fading momentum and a shift toward neutral-to-weak territory.
Key Technical Levels
Immediate support is placed at ₹550–₹520, which may act as a near-term demand zone.
On the upside, resistance is seen at ₹601–₹645, where selling pressure has consistently emerged.
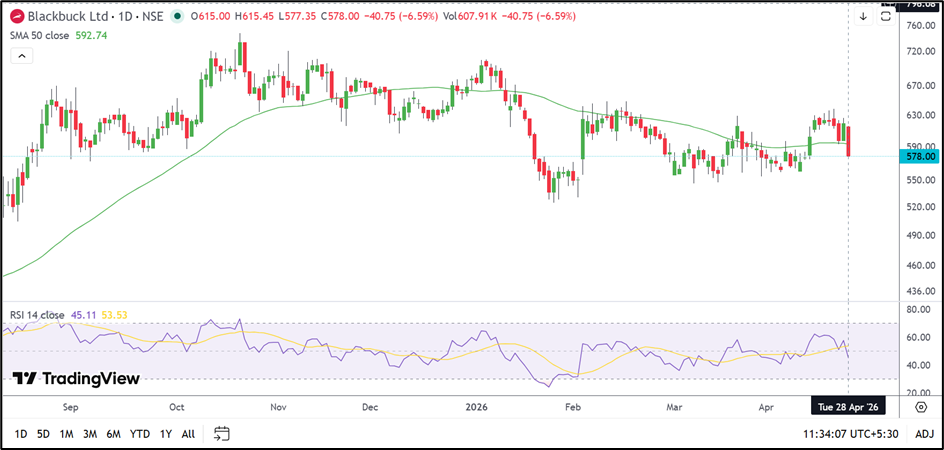
Source: TradingView
Risks To Watch
- Rejection near ₹600 resistance zone
• Price trading below 50-day average
• Momentum weakening on RSI
• Breakdown below ₹550 support
Summary
BlackBuck Limited is facing pressure after failing to sustain above its resistance band. The near-term structure has turned slightly weak, with price slipping below key averages.
Holding ₹550 will be crucial, while a move above ₹601 is needed to stabilise sentiment.
FAQs
Why did BlackBuck stock fall today?
The stock declined after facing resistance near ₹600 and failing to sustain recent levels.
Is the trend turning negative?
Near-term bias is weak as price slips below key averages, though broader structure remains range-bound.
What levels should investors track?
Support at ₹550–₹520 and resistance at ₹601–₹645.