
- Stock declines 5.00% to ₹56.83
• Continues to trade below 50-day SMA
• Momentum remains subdued with RSI near lower band
Overview
Global Surfaces Limited (NSE: GSLSU) is trading near ₹56.83, down 5.00%, extending its weak near-term trend. The stock has been under pressure for the past few months, and the latest move reflects continued downside bias with no strong recovery signals yet.
The price action suggests ongoing consolidation within a broader declining structure.
Fundamental View
For the quarter ended December 2025, the company reported total income of ₹1,630.20 lakh. Profit before tax stood at ₹95.40 lakh, while net profit came in at ₹49.00 lakh. Earnings per share was ₹0.12.
The relatively modest earnings profile keeps the stock sensitive to broader market sentiment and price momentum.
Technical View
Technically, Global Surfaces Limited is trading near ₹56.83 and remains below its 50-day SMA around ₹67.28, indicating a weak structure.
Price action shows a consistent pattern of lower highs and lower lows, with recent attempts to rebound failing near resistance zones. The latest session reflects renewed selling pressure after a brief recovery attempt.
The 14-day RSI is near 40.01 and remains below its signal line, indicating subdued momentum and lack of strong upside traction.
Key Technical Levels
Immediate support is placed at ₹51–₹45, which may act as a demand zone if the decline continues.
On the upside, resistance is seen at ₹62–₹66, where recovery attempts have faced pressure.
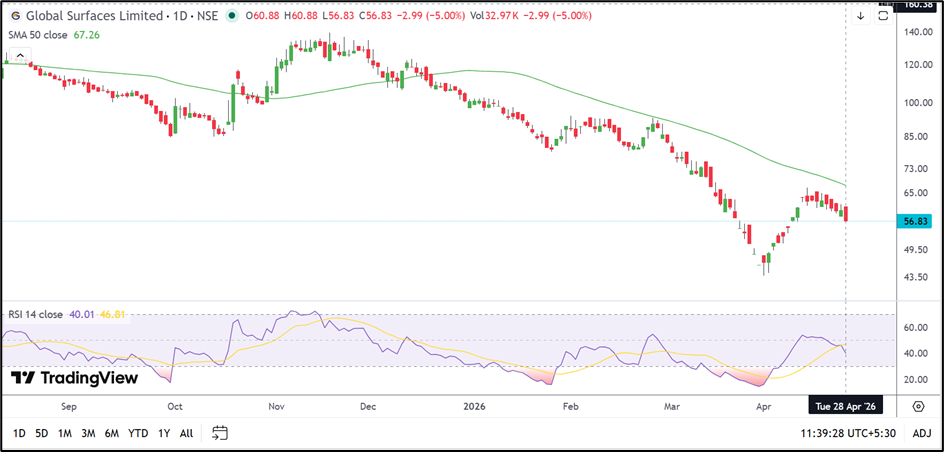
Source: TradingView
Risks To Watch
- Sustained trade below 50-day SMA
• Weak momentum on RSI
• Failure to hold ₹51 support zone
• Continued lower-high price structure
Summary
Global Surfaces Limited continues to face pressure, with price action indicating a weak near-term setup. The broader trend remains soft, and recovery attempts are yet to gain traction.
Holding ₹51 will be important, while a move above ₹62 is needed to improve the outlook.
FAQs
Why is Global Surfaces stock falling?
The stock is under pressure due to a weak technical structure and inability to sustain recovery attempts.
Is there any sign of recovery?
Momentum remains subdued, and the stock is still below key moving averages.
What levels should be tracked?
Support at ₹51–₹45 and resistance at ₹62–₹66.