
- Stock surges 19.99% to ₹90.92, emerging among top gainers
• Sharp rebound after prolonged downtrend signals technical shift
• RSI jumps into overbought zone, indicating possible consolidation
Overview
Emami Realty (NSE: EMAMIREAL) rallied sharply to ₹90.92, gaining 19.99% and locking in an upper circuit, marking one of the strongest moves among real estate stocks. The surge comes after an extended period of weakness, where the stock had been in a sustained downtrend before forming a base in recent sessions.
The current move reflects a sharp technical rebound supported by momentum-driven activity. The price action shows a sudden expansion, indicating aggressive participation in the short term. However, the lack of a clear fundamental trigger suggests that the rally is primarily technical in nature rather than driven by earnings visibility or business improvement.
The stock now enters a crucial phase where follow-through strength will decide whether this breakout evolves into a sustained trend or remains a short-lived spike.
Fundamental View
For the quarter ended December 2025, total income stood at ₹1,210.71 lakh. The company reported a loss before tax of ₹-4,367.10 lakh and a net loss of ₹-3,727.35 lakh, with EPS at ₹-8.50.
The continued losses highlight operational pressure and weak profitability visibility. While the broader real estate space has shown improving traction, the company-specific fundamentals remain under stress. This creates a gap between price action and earnings strength, suggesting the rally is largely momentum-driven at this stage.
Technical View
Technically, Emami Realty has delivered a strong breakout after forming a base at lower levels. The sharp upward move indicates a shift from a declining structure into a rebound phase, supported by strong bullish candles.
The stock is now trading well above its recent range, reflecting improved short-term structure. However, the rally is steep, increasing the probability of near-term exhaustion. The RSI is around 77.65, placing it in overbought territory, which typically leads to consolidation or a mild pullback before continuation.
Key Technical Levels
The stock is approaching a support zone of ₹84.80–₹79.90, which may act as a cushion if profit booking emerges. On the upside, resistance is placed at ₹97.50–₹102.40, where the stock may face pressure as momentum cools.
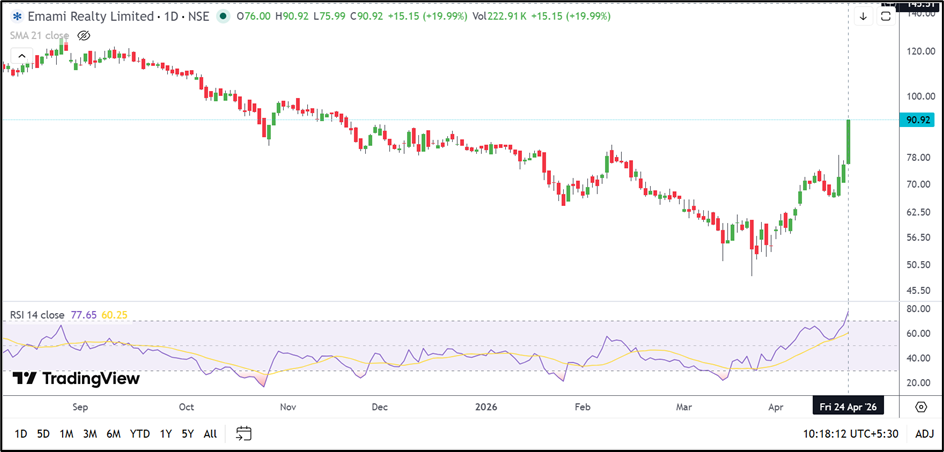
Source: TradingView
Risks To Watch
- Continued losses and weak profitability
• Overbought momentum increasing pullback risk
• Lack of strong fundamental triggers
• High volatility after sharp rally
Summary
Emami Realty’s sharp rally signals a strong technical breakout after a prolonged weak phase. The move reflects improving short-term structure, but sustainability remains the key factor.
With momentum stretched and fundamentals still under pressure, the stock may see consolidation before the next directional move. Holding above support will be important to maintain the current setup.
FAQs
Why did Emami Realty stock surge?
The rally is driven by technical rebound and momentum after a prolonged decline.
Is the stock overbought?
Yes, RSI is above 70, indicating stretched momentum in the short term.
What are the key levels to watch?
Support is at ₹84.80–₹79.90, while resistance is at ₹97.50–₹102.40.