
Highlights
- The stock surged over 9% intraday despite reporting losses for eight consecutive quarters.
- Quarterly financials show negative earnings, with EPS remaining below zero in recent filings.
- Trading activity increased significantly, with high volumes and elevated volatility levels observed.
ITI Limited (NSE:ITI) shares witnessed notable upward movement on April 9, 2026, rising 8.76% to ₹290.10 compared to the previous close of ₹266.75. The stock opened at ₹268.30 and touched an intraday high of ₹298.85, indicating trading momentum during the session. The day’s low was recorded at ₹265.20.
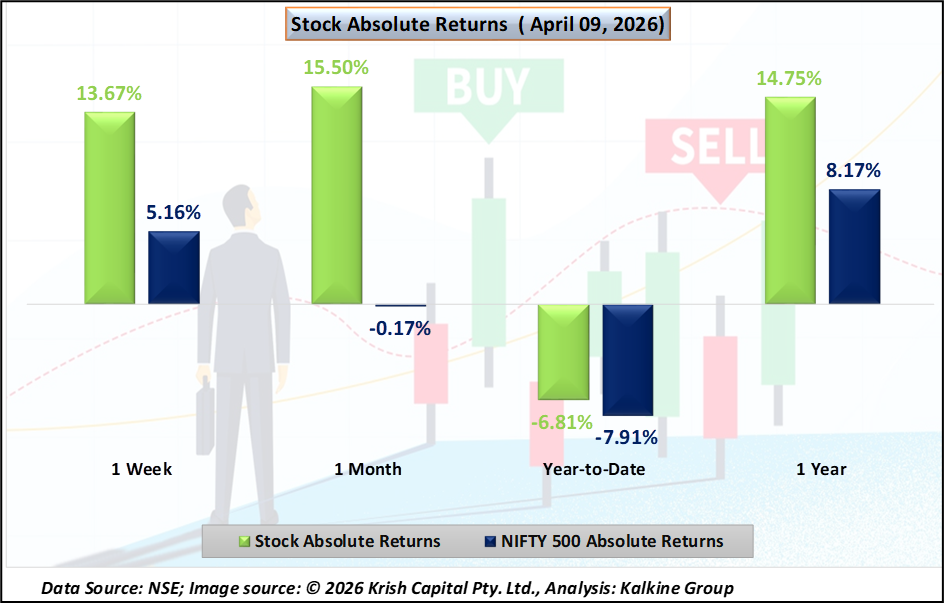
Returns Performance
In terms of short-term performance, the stock outperformed broader indices. ITI delivered a 13.67% return over one week, compared to 5.16% for the NIFTY 500. On a one-month basis, the stock rose 15.50%, while the index remained nearly flat.
Year-to-date performance shows a decline of 6.81%, slightly better than the NIFTY 500’s 7.91% fall. Over longer durations, the stock has delivered 216.58% returns in three years and 149.93% over five years, exceeding index gains during the same periods.
Financial Performance Snapshot
Financial data indicates continued losses in recent quarters. For the quarter ended December 31, 2025, ITI reported total income of ₹52,696 lakh on a consolidated basis. The company posted a loss before tax of ₹2,559 lakh and a net loss of ₹2,533 lakh. Earnings per share stood at -0.26.
Standalone numbers reflected a similar trend, with net loss recorded at ₹2,558 lakh and EPS at -0.27. The company has remained loss-making for the past eight quarters, with trailing EPS also below zero.
Volatility and Price Range
The stock has shown considerable price fluctuations. Its 52-week high stands at ₹372.85, while the 52-week low is ₹234.50. The current trading band is set between ₹213.40 and ₹320.10, reflecting a 20% price band limit.
Daily volatility is recorded at 3.15, while annualised volatility stands at 60.18, indicating relatively high price swings over time.
Key Risks
- Continued losses over multiple quarters may affect investor sentiment and valuation stability.
- High volatility levels increase risk for short-term traders and leveraged positions.
- Low delivery percentage suggests speculative trading rather than long-term accumulation.
- Negative EPS trend indicates pressure on profitability and earnings visibility.
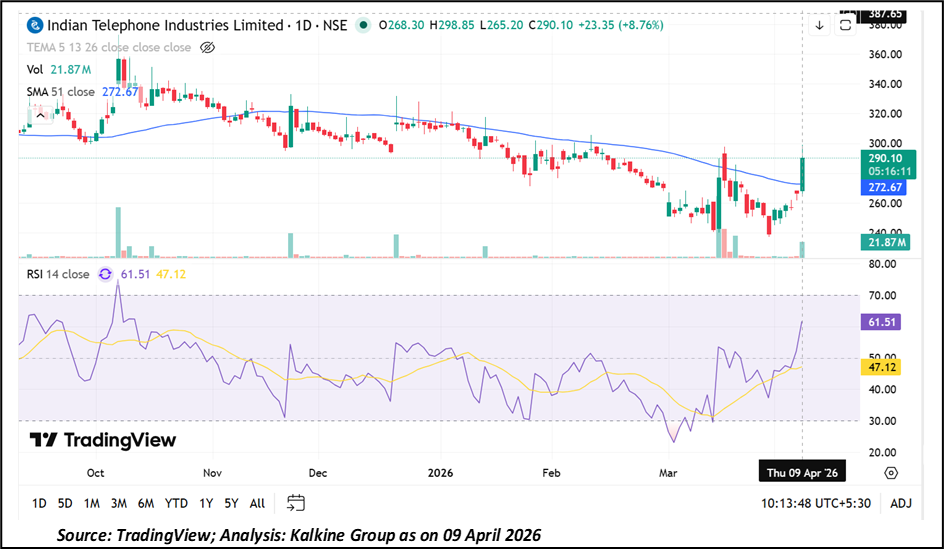
Technical Summary
The stock shows a bullish breakout, rising 8.76% to 290.10 and moving above the 51-day SMA (272.67), which had acted as resistance. The upward candle indicates a shift from the earlier downtrend to a short-term upward trend.
RSI stands at 61.51, moving above its signal line, indicating improving momentum. Volume increased to 21.87M, reflecting higher participation. The 51-day SMA now acts as support, while resistance is seen in the 310–320 range.
Summary
ITI Limited shares rose sharply in the latest session, supported by increased trading volumes and short-term momentum. Despite positive price movement, financial performance remains under pressure with continued losses and negative earnings per share. The stock has delivered long-term returns but also exhibits high volatility. Current trends reflect active trading interest alongside persistent profitability concerns.