
Highlights
- Maruti Suzuki reported higher total production in April 2026 compared to the previous year.
- Utility vehicles and compact cars contributed significantly to the overall production increase.
- Passenger vehicles remained the largest contributor to total production during the month.
Maruti Suzuki India Limited (NSE:MARUTI) reported total production of 2,09,565 units in April 2026, compared to 1,79,956 units in April 2025, reflecting an increase in output. Passenger vehicles accounted for 2,06,097 units, up from 1,76,784 units in the same period last year, while light commercial vehicle production stood at 3,468 units compared to 3,172 units a year ago.
Passenger Vehicles Segment Breakdown
Within passenger vehicles, the mini segment, including Alto and S-Presso, recorded production of 17,745 units, compared to 9,714 units in April 2025. The compact segment, comprising models such as Baleno, Swift, WagonR, and Dzire, reported production of 88,623 units, up from 82,576 units. Total passenger car production stood at 1,06,368 units, compared to 92,290 units in the previous year.
Utility Vehicles Drive Production Growth
Utility vehicles contributed significantly to the overall production numbers. Models such as Brezza, Ertiga, Fronx, and XL6 recorded combined production of 87,518 units in April 2026, compared to 72,640 units in April 2025. The van segment, including Eeco, reported production of 12,211 units, slightly higher than 11,854 units in the previous year.
Light Commercial Vehicles Performance
The light commercial vehicle segment, primarily comprising Super Carry, recorded production of 3,468 units in April 2026, compared to 3,172 units in April 2025, indicating a marginal increase.
Stock Performance and Market Data
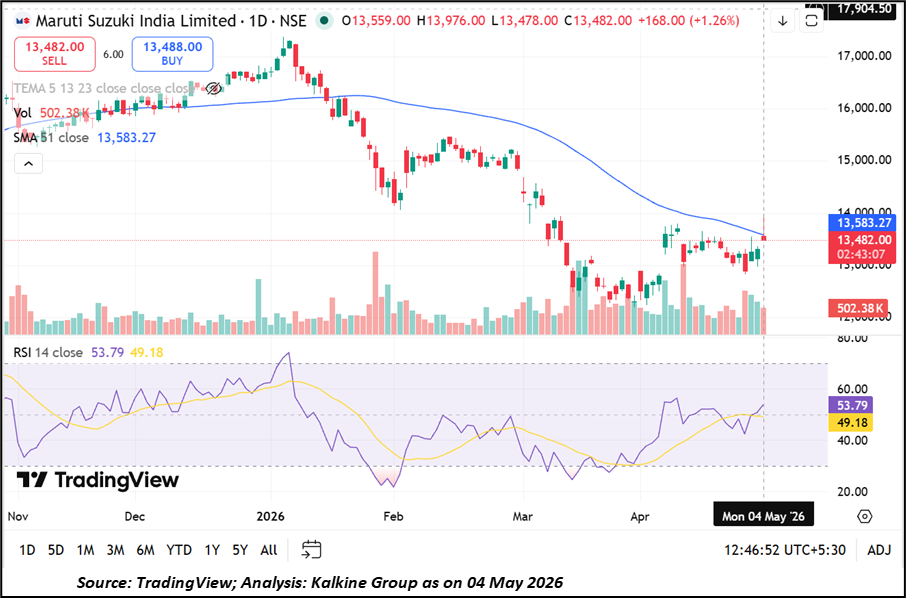
Shares of Maruti Suzuki India Limited (NSE:MARUTI) were trading at ₹13,482.00 on May 4, 2026, up 1.26% from the previous close of ₹13,314.00. The stock opened at ₹13,559.00 and touched an intraday high of ₹13,976.00.
The traded volume stood at 4.88 lakh shares, with a traded value of ₹672.16 crore, while the company’s total market capitalisation was ₹4,25,292.36 crore. The stock gained 2.37% over one week and 7.16% over one month, but declined 18.98% on a year-to-date basis, while delivering a 9.11% return over one year.
Key Risks to Monitor
- Demand changes may impact production planning and inventory levels.
- Increase in input costs may affect manufacturing margins.
- Dependence on specific segments may influence overall production trends.
- Regulatory changes may affect production volumes or product mix.
Summary
Maruti Suzuki India Limited (NSE:MARUTI) reported total production of 2,09,565 units in April 2026, higher than the previous year. Passenger vehicles remained the main contributor, supported by growth in utility vehicles and compact cars. While the stock showed short-term gains, it remains lower on a year-to-date basis despite positive performance over a longer period.
FAQs
- What was Maruti Suzuki’s total production in April 2026?
The company reported total production of 2,09,565 units across passenger and light commercial vehicle segments in April 2026. - Which segment contributed the most to production?
Passenger vehicles contributed the highest share, accounting for over 2 lakh units during April 2026 production. - How did the stock perform recently?
The stock recorded short-term gains but remained negative on a year-to-date basis despite positive one-year returns.