
Highlights
- Bajaj Auto reported a 40% year-on-year increase in total sales for April 2026.
- Export volumes recorded sharp growth and contributed significantly to overall performance.
- Commercial vehicle segment showed faster growth compared to the two-wheeler segment.
Bajaj Auto Limited (NSE:BAJAJ-AUTO) reported total sales of 5,13,792 units in April 2026, compared to 3,65,810 units in April 2025. This reflects a year-on-year growth of 40%. The increase was supported by growth in both domestic and export markets.
Domestic sales rose to 2,48,210 units from 2,20,615 units, showing a 13% increase. Export sales reached 2,65,582 units, compared to 1,45,195 units in the same month last year, registering an 83% rise.
Two-Wheeler Segment Performance
The two-wheeler segment remained the main contributor to total sales volume. Domestic two-wheeler sales increased to 2,10,063 units from 1,88,615 units, up by 11%.
Exports in this segment grew significantly to 2,29,890 units from 1,29,322 units, marking a 78% increase. Total two-wheeler sales stood at 4,39,953 units, compared to 3,17,937 units in April 2025, showing a growth of 38%.
Commercial Vehicle Segment Growth
The commercial vehicle segment recorded higher growth compared to two-wheelers. Domestic sales increased to 38,147 units from 32,000 units, reflecting a 19% rise.
Export volumes in this category rose to 35,692 units from 15,873 units, showing a 125% increase. Total commercial vehicle sales reached 73,839 units, compared to 47,873 units in the previous year, indicating a 54% growth.
Stock Performance and Key Metrics
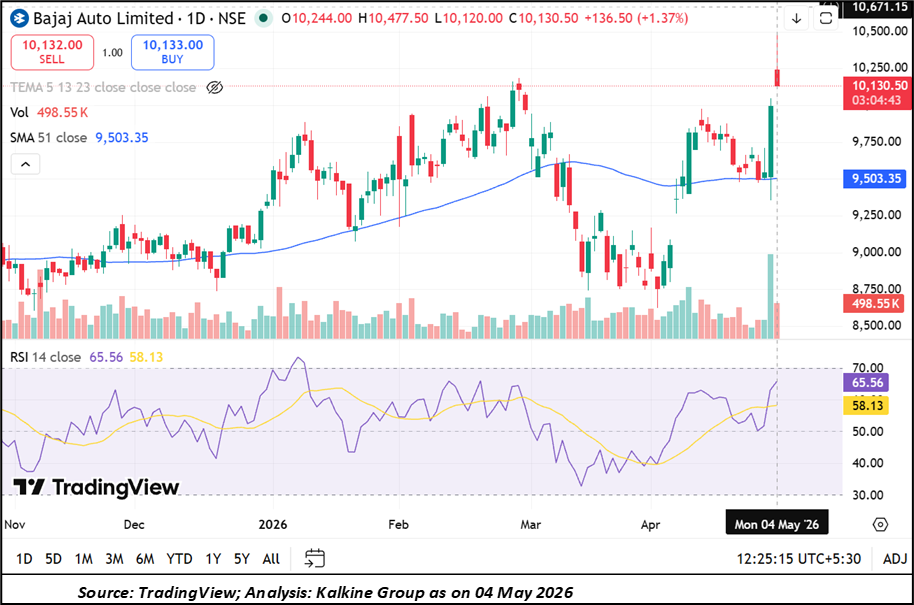
Shares of Bajaj Auto Limited (NSE:BAJAJ-AUTO) were trading at ₹10,130.50 on May 4, 2026, up 1.37% from the previous close of ₹9,994.00. The stock opened at ₹10,244.00 and touched a high of ₹10,477.50, which is also its 52-week high.
The traded volume stood at 4.83 lakh shares, with a traded value of ₹498.78 crore. The company’s market capitalisation was ₹2,83,690.31 crore.
The stock delivered returns of 5.05% over one week and 15.88% over one month. On a one-year basis, it has gained 29.52%.
Key Risks to Monitor
- Export demand may change due to global economic conditions.
- Currency fluctuations can impact earnings from overseas markets.
- Domestic demand depends on consumption trends in urban and rural areas.
- High reliance on two-wheelers may affect performance during segment slowdown.
Summary
Bajaj Auto Limited (NSE:BAJAJ-AUTO) reported a 40% increase in sales for April 2026, supported by growth in both domestic and export markets. Export volumes played a major role, especially in commercial vehicles.
The two-wheeler segment remained the largest contributor. The stock traded higher during the day and stayed near its 52-week high with positive short-term returns.
FAQs
- How much did Bajaj Auto’s sales grow in April 2026?
The company reported a 40% year-on-year increase in total sales volumes for April 2026 across all segments. - Which segment contributed the most to total sales?
The two-wheeler segment contributed the highest share of total sales volume during April 2026. - How did exports perform during the month?
Exports recorded strong growth of 83% year-on-year, contributing significantly to the company’s overall sales increase.