

Highlights
- Q1 FY27 consolidated revenue increased around 38.00% year-on-year.
- India business also reported approximately 38.00% revenue growth.
- Store expansion remains a key growth driver.
- Stock gained over 4.50% during the session.
- Investors await detailed quarterly financial results.
Overview
Kalyan Jewellers India Limited is one of India's leading jewellery retailers, offering gold, diamond, precious stone, platinum, silver, and wedding jewellery through an extensive network of showrooms across India and international markets. The company continues to expand its retail footprint while focusing on branded jewellery and customer experience.
Q1 Business Update Keeps the Stock in Focus
Kalyan Jewellers remained in focus after reporting its business update for the first quarter of FY27. The company reported consolidated revenue growth of approximately 38.00% year-on-year, while its India operations also recorded revenue growth of around 38.00%, supported by healthy same-store sales growth and continued demand across key markets. Market participants also monitored the company's ongoing showroom expansion strategy, which remains an important part of its long-term business plans.
Fundamental View
The company continues to expand its retail presence through a franchise-led model while strengthening its position in the organized jewellery market. Investors will now look forward to the detailed quarterly earnings announcement for updates on profitability, margins, operating performance, and expansion plans following the healthy revenue growth reported during the quarter.
Technical View
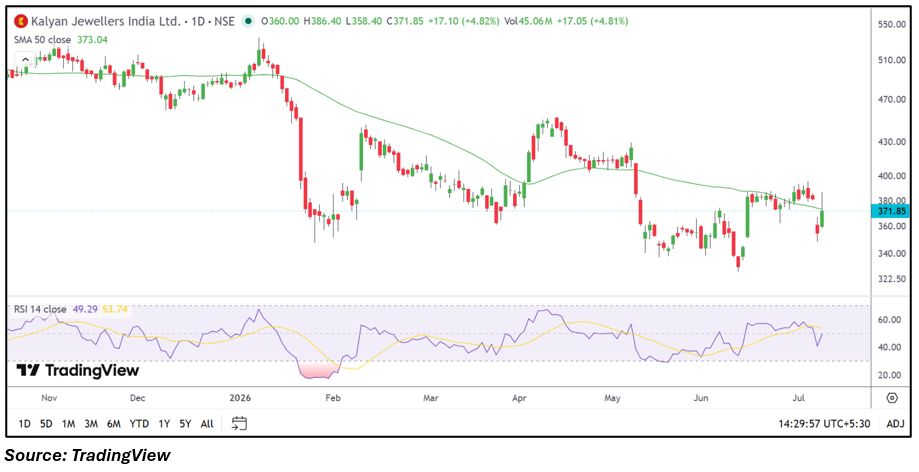
Kalyan Jewellers traded near ₹371.85 after opening at ₹360.00 and touching an intraday high of ₹386.40. The stock is trading close to its 50-day Simple Moving Average of ₹373.04, indicating that recent buying has helped it recover towards an important technical level. The 14-day Relative Strength Index stood at 49.29, suggesting balanced momentum after rebounding from recent lows.
Key Technical Levels
Immediate support is placed near ₹358.40, followed by ₹340.00. On the upside, immediate resistance is seen around ₹386.40, while a sustained move above this level could improve the near-term price structure.
Risks to Watch
- Detailed Q1 FY27 financial results.
- Margin performance amid gold price volatility.
- Store expansion execution.
- Consumer demand during the festive and wedding seasons.
- Changes in jewellery purchasing trends.
Summary
Kalyan Jewellers remained in focus following its Q1 FY27 business update, with revenue growth reflecting continued business activity during the quarter. Going forward, investors will closely monitor the company's quarterly earnings, profitability, retail expansion, and management commentary for additional insights into its growth trajectory.
FAQs
Q: Why is Kalyan Jewellers in focus today?
Kalyan Jewellers is in focus after reporting its Q1 FY27 business update, with consolidated revenue growing approximately 38.00% year-on-year.
Q: How much revenue growth did Kalyan Jewellers report in Q1 FY27?
The company reported consolidated revenue growth of around 38.00% year-on-year, while its India operations also recorded approximately 38.00% growth.
Q: What are investors watching next?
Investors will closely monitor the detailed quarterly financial results, margin performance, expansion progress, and management commentary.
Q: What does the technical chart indicate?
The stock is trading near its 50-day Simple Moving Average, while the RSI around 49.29 indicates balanced momentum following the recent recovery.