
Highlights
- Hindustan Zinc shares gained more than 3% during Tuesday’s NSE session.
- The stock outperformed the NIFTY NEXT 50 across multiple periods.
- Exchange data highlighted promoter encumbrance exceeding 50% in the scrip.
Hindustan Zinc Limited (NSE:HINDZINC) shares traded higher during the May 12 session on the National Stock Exchange. The stock was trading at INR 651.10, up 3.50% from the previous close of INR 629.10.
The stock opened at INR 647.00 and touched an intraday high of INR 653.25 during the session. The intraday low remained at INR 641.80.
Hindustan Zinc shares continued trading below their 52-week high of INR 733.00 recorded on January 27, 2026.
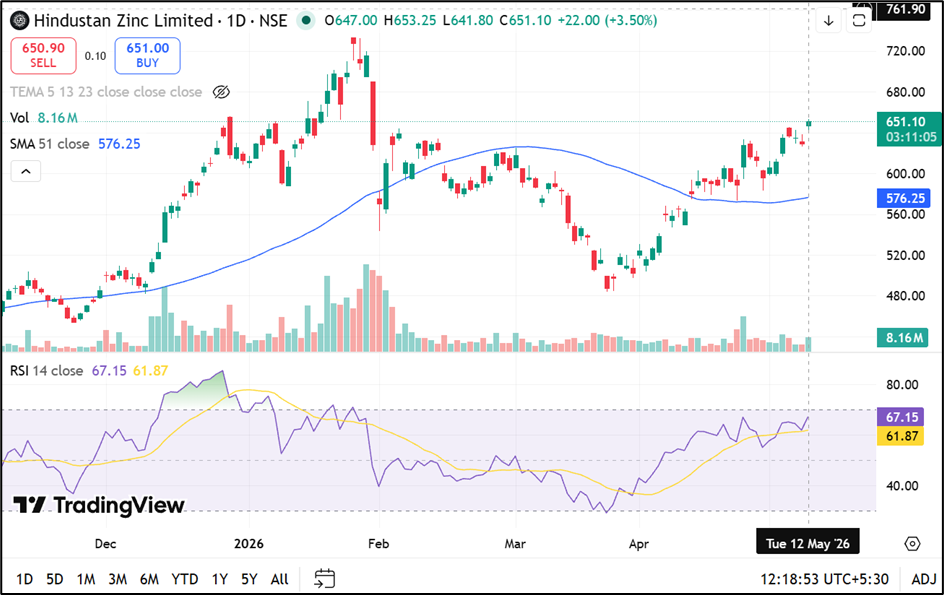
Source: TradingView
Trading Volumes and Market Capitalisation
The stock recorded traded volume of 78.70 lakh shares during the session, while traded value stood at INR 510.73 crore.
The company’s total market capitalisation stood at INR 2,74,983.76 crore, while free float market capitalisation was INR 28,114.41 crore. The stock’s VWAP during the session was INR 648.93.
Deliverable quantity as a percentage of traded quantity stood at 34.85%, while the impact cost remained low at 0.02.
Performance Compared With NIFTY NEXT 50
Hindustan Zinc shares outperformed the NIFTY NEXT 50 index across all tracked periods.
The stock gained 6.42% over one week and 15.21% over one month, compared with declines and moderate gains in the benchmark index.
On a year-to-date basis, Hindustan Zinc shares advanced 6.30%, while the NIFTY NEXT 50 index remained marginally negative.
Over one year, the stock gained 49.56%, compared with a 6.80% rise in the benchmark index.
The company also delivered returns of 109.60% over three years and 105.14% over five years.
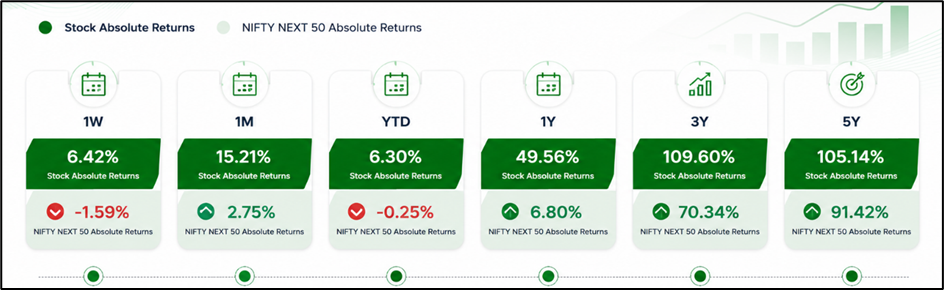
Source: NSE
Volatility and Business Operations
The stock recorded annualised volatility of 49.86%, while daily volatility stood at 2.61.
Hindustan Zinc touched its 52-week low of INR 413.50 on August 1, 2025. The applicable margin rate stood at 20.52%, while the face value remained INR 2 per share.
Exchange data also highlighted overall promoter encumbrance exceeding 50% in the scrip.
According to the company profile, Hindustan Zinc operates in zinc, lead, and silver production and remains among the world’s largest integrated zinc producers and silver producers.
Key Risks Investors Monitor
- Metal price fluctuations may affect revenue and earnings trends.
- High promoter encumbrance remains a key monitoring factor.
- Global industrial demand changes may impact commodity markets.
- Mining regulations can influence operational performance and costs.
Summary
Hindustan Zinc (NSE:HINDZINC) shares climbed more than 3% during Tuesday’s NSE trading session amid active investor participation in metal sector stocks. The company outperformed the NIFTY NEXT 50 index across multiple periods while trading below its 52-week high. Investors continue monitoring global commodity demand, mining sector developments, metal prices, and promoter encumbrance indicators linked to the stock.
FAQs
Q: What was Hindustan Zinc share price on May 12, 2026?
A: Hindustan Zinc shares traded at INR 650.80, up 3.45% during the NSE session.
Q: What is the 52-week high level of Hindustan Zinc shares?
A: The stock’s 52-week high was INR 733.00, recorded on January 27, 2026.
Q: What key indicator was highlighted for Hindustan Zinc stock?
A: Exchange data indicated promoter encumbrance exceeding 50% in the company’s shares.