
UltraTech Cement Limited (NSE:ULTRACEMCO) reported strong operational and financial performance for the quarter and year ended March 31, 2026, supported by rising cement volumes, improved operational efficiencies, and sustained infrastructure demand across India. The company continues to expand capacity aggressively, reinforcing its leadership position in India’s cement industry.
Stock Reaction
Shares of UltraTech Cement Limited were trading around ₹11,871, declining about 1.16% in the latest session, reflecting mild profit booking after a recent recovery rally. Despite short-term consolidation, the stock remains near its 50-day moving average, indicating stabilising momentum amid improving sector demand.
Q4FY26 Financial Performance
UltraTech Cement delivered strong quarterly growth during Q4FY26, supported by rising volumes and improved pricing realisations.
Consolidated net sales increased to ₹25,467 crore in Q4FY26, compared with ₹22,788 crore in Q4FY25, reflecting robust demand across infrastructure and housing sectors. Consolidated operating EBITDA rose to ₹5,600 crore, while total EBITDA stood at ₹5,688 crore, indicating operational efficiency gains.
Profit after tax (PAT) for Q4FY26 increased to ₹3,000 crore, compared with ₹2,475 crore in the corresponding quarter last year, reflecting improved profitability and disciplined cost control.
Operational metrics remained strong, with domestic grey cement volume reaching 42.41 million tonnes, representing 9.3% YoY growth, while consolidated sales volumes rose 9.0% YoY to 44.71 million tonnes.
FY26 Financial Performance
For the full financial year FY26, UltraTech Cement delivered solid growth across revenue and profitability.
Consolidated net sales increased to ₹87,384 crore, compared with ₹74,936 crore in FY25. Operating EBITDA rose significantly to ₹17,020 crore, while total EBITDA increased to ₹17,598 crore, reflecting strong operational leverage.
Annual profit after tax improved to ₹8,188 crore, compared with ₹6,040 crore in FY25, highlighting consistent earnings momentum driven by higher volumes and cost optimisation initiatives.
Operating cash flow remained strong at ₹13,496 crore, supporting capital expenditure and expansion initiatives.
Strategic Impact and Growth Initiatives
UltraTech Cement continues to pursue an aggressive expansion strategy aimed at strengthening its market leadership and capturing long-term infrastructure growth opportunities.
The company commissioned 2.7 MTPA of new grey cement capacity during Q4FY26, increasing total capacity to 196.8 MTPA.
Looking ahead, the company plans to increase total cement capacity to 242.5 MTPA by FY28, driven by greenfield and brownfield expansions across multiple states.
Additionally, UltraTech has expanded its renewable energy footprint, with 1.39 GW renewable power capacity and a 43% green power mix, supporting long-term cost efficiency and sustainability goals.
Cost and Efficiency Trends
UltraTech Cement continues to benefit from efficiency improvements across logistics, power, and fuel management.
According to the cost indicator, logistics costs accounted for 32% of total costs, while fuel and power costs accounted for 21% and 9%, respectively. Power costs declined to ₹325 per tonne, reflecting higher renewable energy usage and operational optimisation.
These initiatives support margin resilience despite volatility in fuel and raw material prices.
Outlook
UltraTech Cement remains well-positioned to benefit from strong infrastructure spending, housing demand, and government-led capital expenditure initiatives. Continued capacity expansion and cost optimisation strategies are expected to support long-term revenue growth and profitability, reinforcing the company’s dominant position in India’s cement sector.
Technical Summary
UltraTech Cement trades near ₹11,871, hovering around its 50-day SMA near ₹11,830, indicating consolidation after recovery. RSI near 54 signals neutral-to-positive momentum. Immediate resistance lies near ₹12,300–₹12,400, while support is visible around ₹11,600. Sustained breakout above resistance could confirm continuation of the medium-term uptrend.
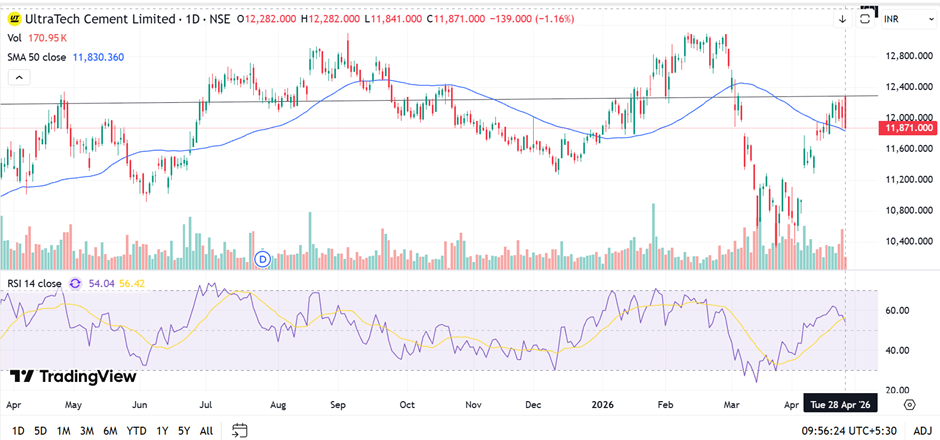
Chart by TradingView
Conclusion
UltraTech Cement delivered strong earnings growth in FY26, supported by higher volumes, expanding capacity, and cost optimisation initiatives. Continued investments in renewable energy and infrastructure-linked demand provide long-term visibility. With strong cash flows and expansion momentum, the company remains well-positioned to capitalise on India’s infrastructure-driven growth cycle.
FAQs
- What drove UltraTech Cement’s revenue growth in Q4FY26?
Revenue growth was supported by higher cement volumes, improved pricing realisations, and strong infrastructure and housing demand across regions. - How is UltraTech Cement expanding its production capacity?
The company plans multiple greenfield and brownfield projects, targeting capacity expansion to over 240 MTPA by FY28. - What are UltraTech Cement’s key long-term growth drivers?
Infrastructure spending, housing demand, renewable energy adoption, and capacity expansion remain the primary long-term growth drivers for the company.