
Highlights
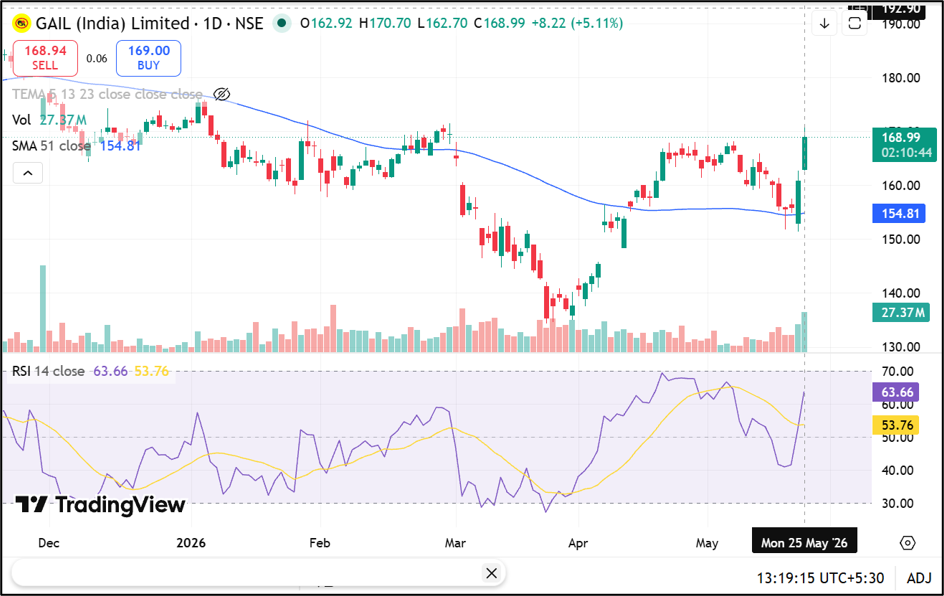
- GAIL shares gained 5.07 percent during May 25 afternoon trading session.
- Stock traded near upper range after touching INR 170.70 intraday high.
- Market capitalisation of GAIL crossed INR 1.11 lakh crore during session.
GAIL (India) Limited (NSE:GAIL) shares climbed 5.11 percent on May 25, 2026, reaching INR 168.99 during afternoon trade on the National Stock Exchange of India. The stock opened at INR 162.92 and moved to an intraday high of INR 170.70. The session low stood at INR 162.70.
Trading activity remained elevated with 272.48 lakh shares changing hands. Traded value during the session reached INR 459.48 crore, while the company’s market capitalisation stood at INR 1,11,040.28 crore.
Source: Trading View
Natural Gas Infrastructure Remains Core Business
GAIL operates across natural gas transmission, marketing, liquefied petroleum gas transmission, petrochemicals, and city gas distribution-related segments. The company remains one of India’s major gas transmission and distribution entities with operations linked to energy infrastructure development and gas supply networks. GAIL is also active in petrochemical manufacturing and related downstream energy businesses.
Trading Indicators Reflect Stable Volatility
The stock reported annualised volatility of 34.58, while daily volatility stood at 1.81 during the session. Deliverable quantity as a percentage of traded quantity stood at 32.51 percent.
Impact cost remained low at 0.02, indicating relatively high liquidity in trading activity. The stock traded below its 52-week high of INR 202.79 recorded on June 12, 2025, while remaining above the 52-week low of INR 134.36 touched in March 2026.
Stock Performance Remains Mixed Across Timeframes
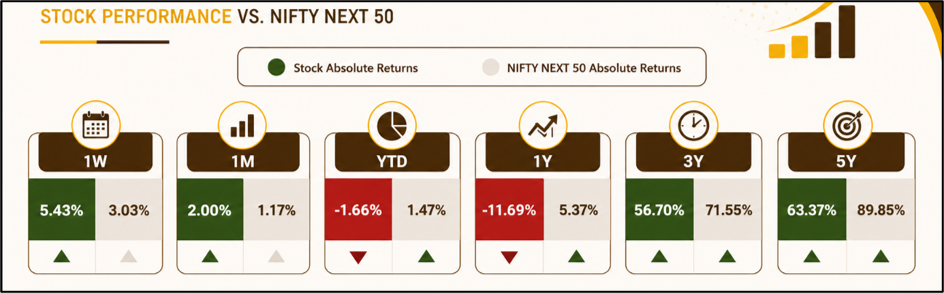
GAIL outperformed the NIFTY NEXT 50 index over shorter periods but lagged over longer durations. The stock delivered returns of 5.43 percent in one week against 3.03 percent for the benchmark index. One-month returns stood at 2 percent compared with 1.17 percent for the NIFTY NEXT 50.
Year-to-date returns remained negative at 1.66 percent decline, while one-year returns showed a fall of 11.69 percent. Over a three-year period, GAIL generated returns of 56.70 percent, while five-year returns stood at 63.37 percent.
Source: NSE
Key Risks
- Energy price fluctuations may impact profitability and operating performance.
- Regulatory changes could affect gas transmission tariffs and margins.
- Demand slowdown in industrial sectors may impact gas consumption volumes.
- Commodity market volatility may influence investor sentiment toward energy stocks.
Summary
GAIL shares rose more than 5 percent during May 25 trading, with the stock touching an intraday high of INR 170.70 amid active market participation. The company’s market capitalisation crossed INR 1.11 lakh crore during the session. While shorter-term stock performance outpaced the NIFTY NEXT 50, returns over one-year and longer periods remained mixed.
FAQs
Q: How much did GAIL shares rise during May 25 trading?
A: GAIL shares gained 5.07 percent and touched an intraday high of INR 170.70 during trading.
Q: What is GAIL’s current market capitalisation?
A: GAIL’s total market capitalisation stood at approximately INR 1.11 lakh crore during the trading session.
Q: Which sectors does GAIL operate in?
A: GAIL operates in gas transmission, petrochemicals, energy infrastructure, and gas marketing-related businesses.