

Highlights
- Pace Digitek shares gained over 6 percent during the May 26 trading session.
- Stock touched intraday high near upper price band amid strong trading activity.
- Volumes and turnover remained elevated compared with recent sessions.
Pace Digitek Limited (NSE:PACEDIGITK) shares traded higher on May 26, 2026, rising 6.19 percent to INR 202.19 during the session. The stock opened at INR 199.90 and moved to an intraday high of INR 210.70 before stabilizing near mid-session levels.
The stock traded within a broad intraday range between INR 196.42 and INR 210.70. It remained close to its upper price band level of INR 228.48, reflecting heightened trading interest during the session.
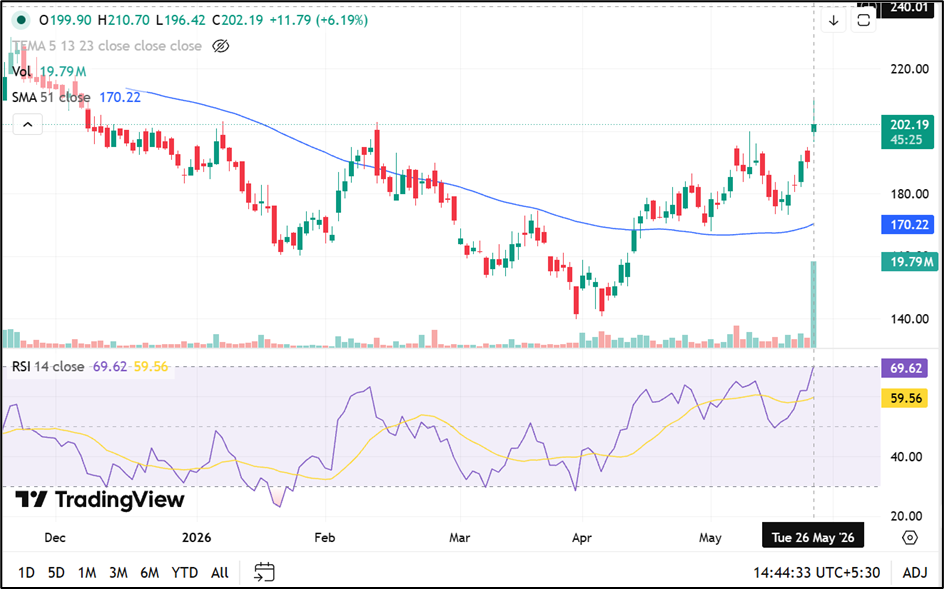
Source: TradingView
Strong Trading Activity and Liquidity
Market activity in Pace Digitek remained elevated with traded volume of 196.96 lakh shares and traded value of INR 404.73 crore. The volume-weighted average price stood at INR 205.49, indicating steady price discovery during the session.
The stock’s impact cost was recorded at 0.10, suggesting relatively efficient liquidity conditions. Deliverable quantity stood at 22.64 percent of traded volume, indicating a mix of delivery-based and short-term trading participation.
Performance Trend Across Timeframes
Pace Digitek has shown varied performance across time horizons. The stock gained 13.69 percent over the past week and 17.05 percent over the past month, while year-to-date returns stood at 7.91 percent.
Despite recent gains, the stock remains below its 52-week high of INR 231.95 recorded in October 2025. It is, however, trading well above its 52-week low of INR 139.81 marked in March 2026.
Volatility and Market Metrics
The stock recorded daily volatility of 1.96 and annualised volatility of 37.45, reflecting moderate price fluctuation patterns. The applicable margin rate stood at 16.28 percent.
Pace Digitek’s total market capitalisation stood at INR 4,378.33 crore, while free float market capitalisation was INR 1,335.13 crore, indicating a mid-sized listed company profile within the infrastructure segment.
Business Overview
Incorporated in 2007, Pace Digitek Limited operates in telecom infrastructure and solar energy solutions. The company is engaged in manufacturing, installation, and commissioning of DC power systems, lithium batteries, monitoring systems, and inverter technologies.
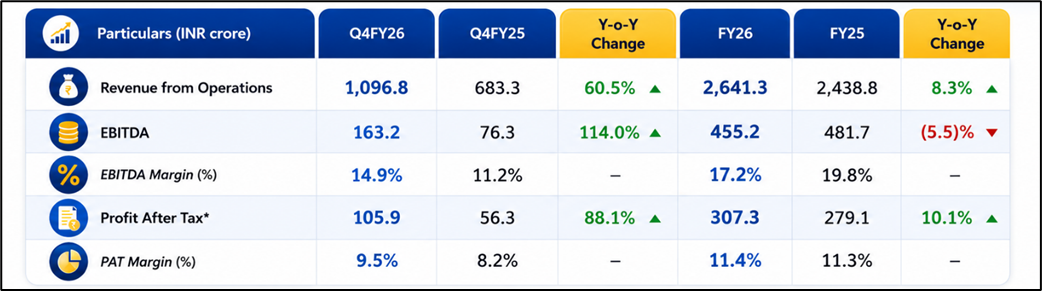
Source: Company Filing
Key Risks
- High trading volumes may increase short-term price volatility risk.
- Stock remains below 52-week high, indicating incomplete recovery trend.
- Exposure to telecom and solar capex cycles affects revenue visibility.
- Lower deliverable percentage suggests higher speculative trading share.
Summary
Pace Digitek Limited (NSE:PACEDIGITK) shares rose over 6 percent on May 26, supported by strong trading volumes and active market participation. The stock moved close to its upper price band during intraday trade while maintaining gains across weekly and monthly timeframes. Despite recent upward movement, it remains below its 52-week peak. Market participants continue tracking volatility, liquidity trends, and sector demand conditions in telecom and solar infrastructure.
FAQs
Q: Why did Pace Digitek shares rise today?
A: The stock gained over 6 percent amid strong volumes and active intraday trading participation.
Q: What was the intraday high for Pace Digitek?
A: The stock touched an intraday high of INR 210.70 during the trading session.
Q: What sectors does Pace Digitek operate in?
A: It operates in telecom infrastructure and solar energy solutions, including power systems and batteries.