

Highlights
- Hariom Pipe Industries shares surged nearly 20 percent during Monday’s trading session.
- The stock touched the upper circuit amid sharp rise in trading volumes and value.
- One-week and one-month returns significantly outperformed benchmark NIFTY 50 index movement.
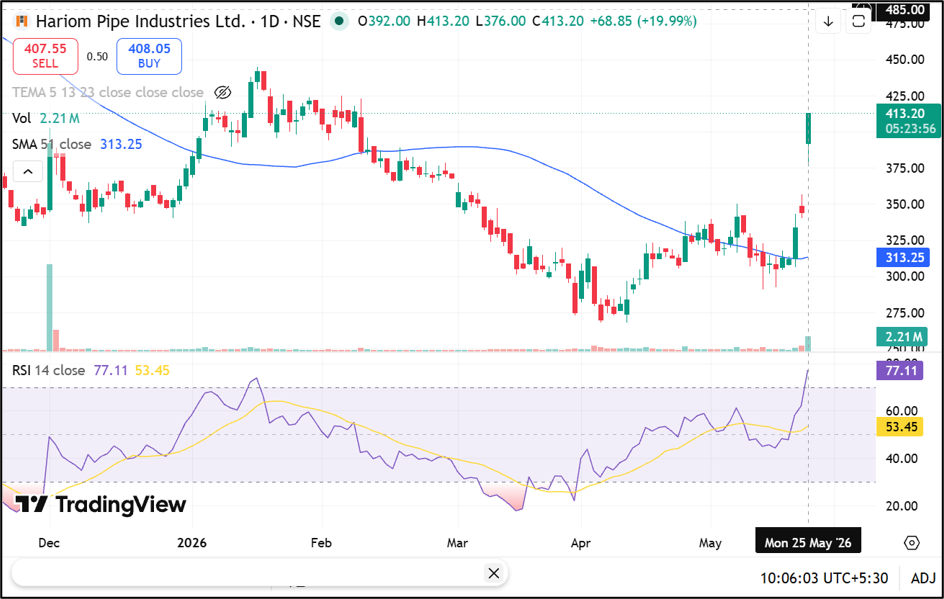
Shares of Hariom Pipe Industries Limited (NSE:HARIOMPIPE) climbed 19.99 percent to INR 413.20 on 25 May 2026, hitting the upper circuit limit during morning trade.
The stock opened at INR 392.00 and touched an intraday high of INR 413.20. The day’s low stood at INR 376.00, while the volume weighted average price was recorded at INR 396.79. The previous closing price for the stock was INR 344.35.
Source: Trading View
Trading Activity Remains Elevated
Hariom Pipe Industries witnessed active market participation during the session. Traded volume reached 21.96 lakh shares, while traded value stood at INR 87.15 crore. The company’s total market capitalisation was reported at INR 1,279.57 crore.
Free float market capitalisation stood at INR 545.37 crore. The stock traded within a daily price band of INR 275.50 to INR 413.20. Deliverable quantity as a percentage of traded quantity came at 39.42 percent.
Short-Term Returns Outpace Benchmark
The stock delivered higher short-term returns compared with benchmark indices across multiple periods. Hariom Pipe Industries gained 35.23 percent over one week, while the NIFTY 50 index advanced 1.22 percent during the same timeframe. Over one month, the stock rose 34.29 percent against a 0.17 percent gain in the benchmark index.
Year-to-date returns stood at 7.93 percent compared with a decline of 8.45 percent in NIFTY 50. However, longer-term performance remained under pressure. The stock declined 31.33 percent over three years, while five-year returns stood flat.
Volatility and Price Range Indicators
Hariom Pipe Industries recorded a 52-week high of INR 572.20 on 22 September 2025. The stock’s 52-week low was INR 268.05, recorded on 13 April 2026.
The stock reported daily volatility of 3.10 and annualised volatility of 59.23, indicating elevated price movement levels. Impact cost during the session stood at 0.12. The applicable margin rate for the stock was reported at 23.91 percent.
Key Risks Investors May Monitor
- Elevated volatility may increase short-term trading risks significantly.
- Upper circuit movement can reduce liquidity during trading sessions.
- Long-term negative returns may influence broader investor sentiment.
- Mid-cap stocks may remain sensitive to market-wide corrections.
Summary
Hariom Pipe Industries (NSE:HARIOMPIPE) shares surged nearly 20 percent on 25 May 2026 and hit the upper circuit during active market trade. The stock witnessed sharp gains in weekly and monthly returns compared with benchmark indices. Trading volumes and traded value also increased significantly, while volatility indicators remained elevated during the session.
FAQs
Q: Why did Hariom Pipe Industries shares rise sharply today?
A: The stock hit the upper circuit amid active trading volumes and strong short-term market performance.
Q: What was Hariom Pipe Industries’ intraday high on 25 May 2026?
A: The stock touched an intraday high of INR 413.20 during Monday’s trading session.
Q: What is the 52-week high level for Hariom Pipe Industries stock?
A: The stock’s 52-week high stands at INR 572.20 recorded in September 2025.