

Highlights
- Modison Limited shares hit a 20 percent upper circuit during Monday trading session.
- The stock reached a fresh 52-week high following audited March 2026 financial disclosures.
- Net profit and earnings per share figures reflected growth in the latest reported quarter.
Shares of Modison Limited (NSE:MODISONLTD) climbed 20 percent to INR 209.28 on 25 May 2026, touching the upper price band during early trading hours. The stock opened at INR 209.28 and remained locked at the same level through the session cited in the exchange filing data. The previous close stood at INR 174.40.
The rally also pushed the stock to a new 52-week high of INR 209.28. The company’s lower circuit for the day was placed at INR 139.52, while the applicable price band remained 20 percent.
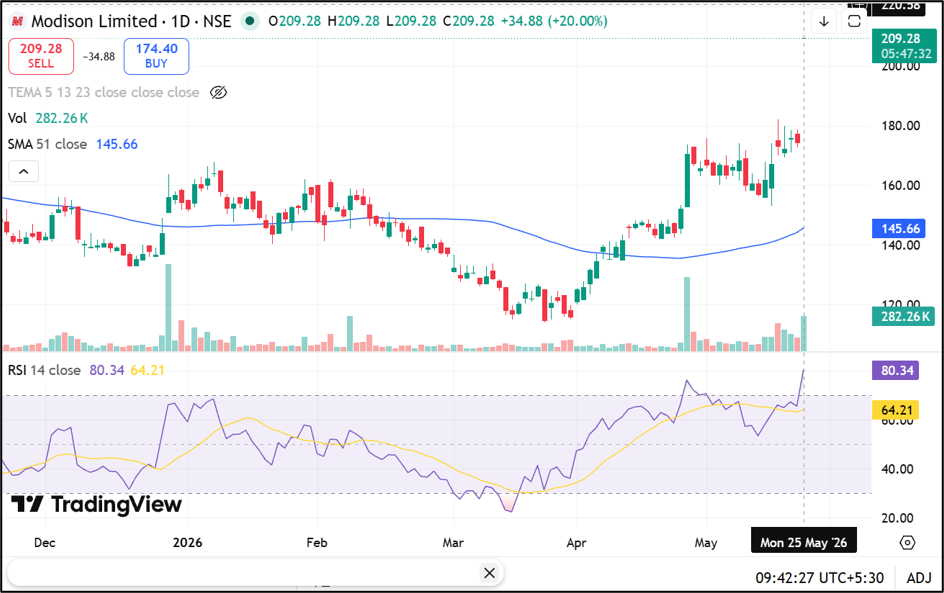
Source: Trading View
Returns Outpace Benchmark Indices
Modison Limited has delivered higher absolute returns compared with the broader benchmark over multiple periods. The stock gained 25.31 percent in one week, while the NIFTY 50 index recorded 1.28 percent during the same period. On a one-month basis, the stock advanced 45.15 percent against the NIFTY 50 movement of 0.23 percent.
Year-to-date returns stood at 37.62 percent, while one-year gains reached 50.97 percent. Longer-term performance data showed returns of 197.27 percent over three years and 256.83 percent across five years.
Quarterly Financials Released
According to NSE data for the quarter ended 31 March 2026, the company reported consolidated total income of INR 28,911.95 lakh. Profit before tax came at INR 4,780.11 lakh, while net profit stood at INR 3,600.23 lakh. Earnings per share for the consolidated business were reported at 11.09.
Standalone financials for the same period showed total income of INR 28,911.96 lakh. Profit before tax was INR 4,780.15 lakh and net profit came at INR 3,603.35 lakh. Earnings per share for the standalone entity stood at 11.10. The audited financial filings were broadcast to exchanges on 22 May 2026.
Trading Activity and Market Metrics
Trading volumes reached 2.75 lakh shares during the session, with traded value reported at INR 5.76 crore. The company’s total market capitalisation stood at INR 679.11 crore, while free float market capitalisation was INR 325.04 crore.
The stock recorded an impact cost of 0.33 and daily volatility of 2.94. Annualised volatility was reported at 56.17.
Deliverable quantity as a percentage of traded quantity stood at 65.80 percent, indicating significant delivery-based participation during the trading session.
Key Risks Investors May Track
- High annualised volatility may increase short-term price fluctuations.
- Upper circuit movement can limit trading liquidity during market hours.
- Smaller market capitalisation may lead to wider price swings.
- Concentrated trading activity may elevate speculative participation risks.
Summary
Modison Limited (NSE:MODISONLTD) shares surged 20 percent to hit the upper circuit at INR 209.28 on 25 May 2026. The stock also touched a fresh 52-week high. Trading volumes and delivery-based activity remained elevated during the session.
FAQs
Q: Why did Modison Limited shares rise on 25 May 2026?
A: The stock hit the upper circuit after audited quarterly financial disclosures and increased market participation.
Q: What was Modison Limited’s reported net profit for March 2026 quarter?
A: Consolidated net profit for the quarter stood at INR 3,600.23 lakh as per filings.
Q: What was the stock’s 52-week high level?
A: Modison Limited touched a fresh 52-week high of INR 209.28 during Monday trading.