

Highlights
- Greenlam Industries shares climbed more than 13 percent during Monday’s trading session.
- The stock approached its 52-week high amid increased market participation and traded volumes.
- One-week and one-month returns outpaced benchmark NIFTY 50 index performance significantly.
Shares of Greenlam Industries Limited (NSE:GREENLAM) rose 13.26 percent to INR 268.70 on 25 May 2026 during early market trade. The stock opened at INR 275.60 and touched an intraday high of INR 276.00 before trading near the volume weighted average price of INR 267.13.
The previous closing price stood at INR 237.23. The stock traded within a daily price band range of INR 189.79 to INR 284.67.
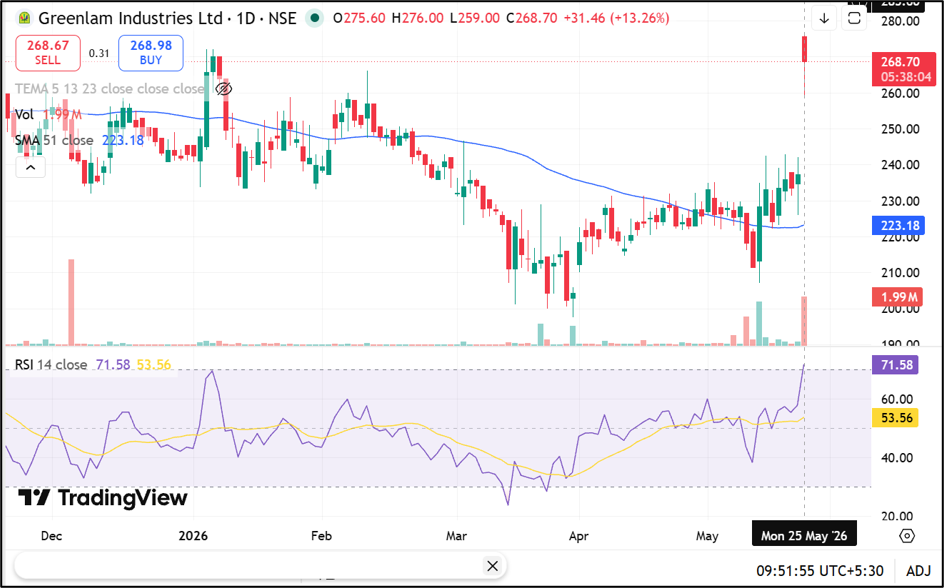
Source: Trading View
Stock Nears 52-Week High
Greenlam Industries moved closer to its 52-week high of INR 279.40 recorded on 28 May 2025. The stock’s 52-week low stood at INR 197.59, touched on 30 March 2026. The latest price movement reflected heightened trading interest, with traded volume reaching 19.03 lakh shares during the session.
Traded value stood at INR 50.82 crore. The company’s total market capitalisation was reported at INR 6,836.68 crore, while free float market capitalisation stood at INR 3,348.60 crore.
Returns Outperform Benchmark Indices
The stock delivered higher short-term returns compared with the NIFTY 50 index across several timeframes. Greenlam Industries gained 19.50 percent over one week, while the benchmark index advanced 1.20 percent.
Over one month, the stock rose 20.11 percent against a 0.15 percent gain in NIFTY 50. Year-to-date returns stood at 10.53 percent compared with a decline of 8.46 percent in the benchmark. On a one-year basis, the stock gained 4.20 percent. Three-year returns were reported at 73.90 percent, while five-year returns remained negative at 52.75 percent.
Trading Metrics and Volatility Levels
Greenlam Industries recorded an impact cost of 0.30 during the trading session. Deliverable quantity as a percentage of traded quantity stood at 49.87 percent. The applicable margin rate for the stock was 19.49 percent. Daily volatility was reported at 2.47, while annualised volatility stood at 47.19.
The stock continued to remain in the EQ series and carried a note that its price-to-earnings ratio exceeded 50 across the previous four trailing quarters.
Key Risks Investors May Monitor
- Elevated valuation metrics may increase sensitivity to earnings performance.
- Higher volatility levels can lead to wider short-term price swings.
- Sharp rallies may trigger profit-booking activity in near-term sessions.
- Broader market weakness could affect sentiment toward mid-cap stocks.
Summary
Greenlam Industries (NSE:GREENLAM) shares gained more than 13 percent on 25 May 2026, approaching their 52-week high during active trading. The stock recorded strong short-term returns compared with benchmark indices and saw increased trading volumes. Market capitalisation exceeded INR 6,800 crore, while volatility indicators and valuation metrics remained elevated during the session.
FAQs
Q: Why did Greenlam Industries shares rise on 25 May 2026?
A: The stock gained during active trading amid higher volumes and positive short-term market performance.
Q: What was Greenlam Industries’ intraday high during the session?
A: The stock touched an intraday high of INR 276.00 during Monday’s trading session.
Q: What is the 52-week high level for Greenlam Industries stock?
A: The stock’s 52-week high stands at INR 279.40 recorded on 28 May 2025.