
Highlights
- Tata Chemicals shares gained 2.98percent and traded near the session high.
- The stock remained below its 52-week high despite a recent rebound.
- Long-term returns continued to lag the broader NIFTY 500 index.
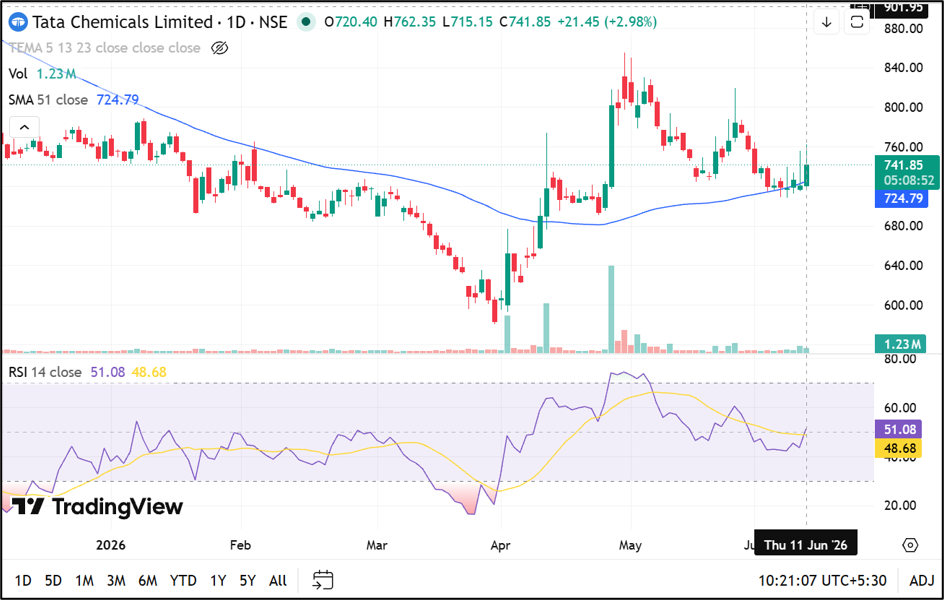
Shares of Tata Chemicals Limited (NSE:TATACHEM) rose 2.98percent on June 11, 2026, to INR 741.85 from the previous close of INR 720.40. The stock witnessed active participation during the trading session, moving between an intraday low of INR 715.15 and a high of INR 762.35. The volume-weighted average price (VWAP) stood at INR 743.33, reflecting trading activity around the prevailing market price. The gain comes even as the stock remains significantly below its 52-week peak recorded last year.
Trading Volumes and Market Capitalisation Draw Attention
Tata Chemicals recorded traded volume of 11.93 lakh shares, translating into traded value of INR 88.67 crore during the session. The company’s total market capitalisation stood at INR 18,933.49 crore, while its free-float market capitalisation was INR 11,584.13 crore. The impact cost was reported at 0.04, indicating liquidity in the counter. Deliverable quantity accounted for 36.87 percent of the total traded quantity, suggesting a mix of delivery-based and short-term transactions.
Stock Remains Between Annual High and Low
Although the stock has recovered from its recent lows, it continues to trade well below its 52-week high of INR 1,026.65 recorded on September 17, 2025. At the same time, it remains comfortably above the 52-week low of INR 580.30 touched on March 30, 2026.
Based on current levels, the stock is approximately 27.6 percent below its annual high while trading nearly 28 percent above its annual low. The upper price band for the session was fixed at INR 864.45, while the lower band stood at INR 576.35.
Short-Term Performance Improves
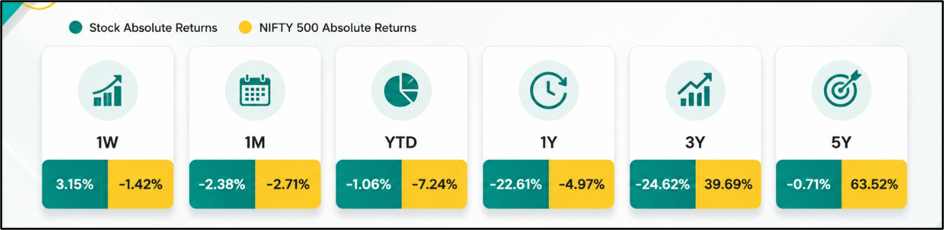
The stock has shown signs of improvement over shorter time frames. Tata Chemicals delivered a return of 3.15 percent over the last week, outperforming the NIFTY 500 index, which declined 1.42 percent during the same period.
Over the past month, the stock slipped 2.38 percent, although the broader index also remained under pressure with a decline of 2.71 percent. On a year-to-date basis, Tata Chemicals fell 1.06 percent, compared with a 7.24 percent decline in the NIFTY 500.
 Source: NSE
Long-Term Returns Trail Benchmark Index
Despite recent gains, Tata Chemicals has underperformed the broader market over longer periods. The stock declined 22.61 percent over the past year, while the NIFTY 500 fell 4.97 percent. Over a three-year period, Tata Chemicals delivered a negative return of 24.62 percent, compared with a gain of 39.69 percent for the benchmark index. The gap becomes more visible over five years, with the stock posting a return of negative 0.71 percent against the NIFTY 500's gain of 63.52 percent.
Volatility Remains Elevated
Market data showed daily volatility of 1.95 percent and annualised volatility of 37.25 percent for Tata Chemicals. Such levels indicate that the stock has experienced considerable price fluctuations over the past year. Investors often monitor volatility indicators as they provide insight into the magnitude of potential price movements and changing market sentiment.
Tata Chemicals and Its Business Operations
Incorporated in 1939, Tata Chemicals Limited is engaged in the manufacture and export of basic chemistry and specialty products. The company operates across various chemical segments and serves domestic as well as international markets. Its operations form part of the broader chemicals industry, which is influenced by demand trends, commodity prices and global economic conditions.
Key Risks
- Long-term returns remain weaker than broader market benchmarks.
- Chemical commodity price fluctuations may affect earnings.
- High volatility can lead to sharp share price movements.
- Global demand conditions may influence business performance.
Share Performance Today
Tata Chemicals shares closed at INR 741.85, gaining INR 22.80 or 2.98percent from the previous close of INR 720.40. The stock touched a high of INR 762.35 and a low of INR 715.15 during the session. Total traded volume stood at 11.93 lakh shares, while traded value reached INR 88.67 crore. The company’s market capitalisation was INR 18,933.49 crore at the prevailing market price.
Source: TradingView
Summary
Tata Chemicals shares advanced 2.98percent on June 11, 2026, amid active trading activity and healthy volumes. The stock continues to trade above its 52-week low but remains significantly below its annual high. While recent performance has improved relative to the broader market, long-term returns continue to lag the NIFTY 500. Investors may continue tracking price movements, volatility levels and broader sector trends.
FAQs
Q: What was Tata Chemicals share price on June 11, 2026?
A: Tata Chemicals shares traded at INR 741.85, gaining 2.98percent compared with the previous closing price.
Q: What are the 52-week high and low levels for Tata Chemicals?
A: The stock's 52-week high was INR 1,026.65, while its 52-week low was INR 580.30.
Q: How has Tata Chemicals performed against the NIFTY 500 index?
A: Tata Chemicals underperformed the NIFTY 500 over one-year, three-year and five-year periods.