

Highlights
- Jubilant Agri and Consumer Products shares rose 17.02% in early trade on August 13, 2026.
- Q1 FY27 total income stood at ₹519.48 crore, with profit before tax of ₹60.99 crore.
- Net profit reached ₹45.53 crore, while EPS stood at ₹30.05.
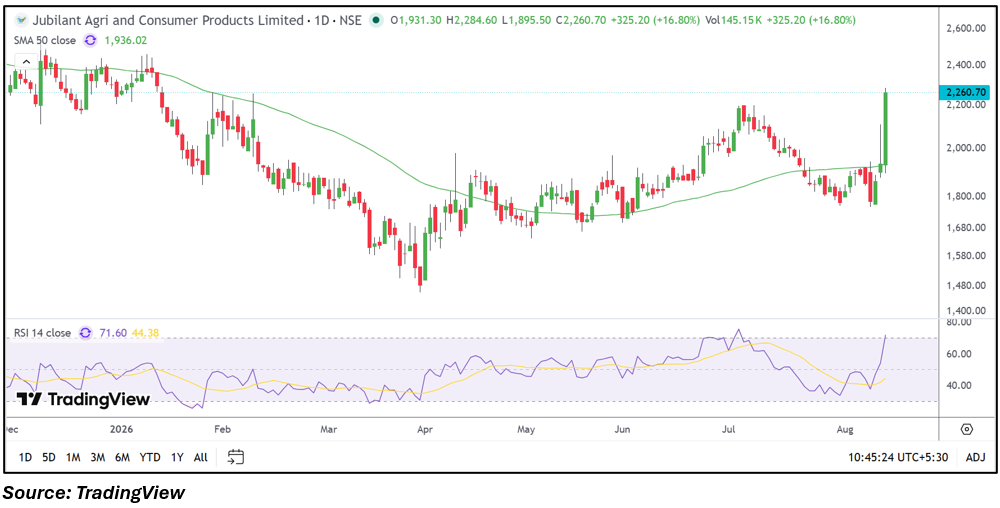
- The stock moved above its 50-day SMA of ₹1,936.02 during the session.
- Trading volume was approximately 145.15 thousand shares, with VWAP at ₹2,187.89.
- Investors should monitor earnings sustainability, segment performance, margins and price behaviour after the sharp move.
Overview
Jubilant Agri and Consumer Products Limited (NSE: JUBLCPL) operates across performance polymers and chemicals, P&K fertilizers and agri-nutrient businesses. The stock gained 17.02% on August 13, 2026, rising to ₹2,265.00 from the previous close of ₹1,935.50. It opened at ₹1,931.30, touched a high of ₹2,284.60 and recorded a low of ₹1,895.50. VWAP stood at ₹2,187.89, while approximately 145.15 thousand shares were traded. The market move followed the company's latest June 2026 quarterly results, which showed total income of ₹519.48 crore and net profit of ₹45.53 crore. (NSE India Archives)
Fundamental View
For Q1 FY27, Jubilant Agri and Consumer Products reported total income of ₹519.48 crore, profit before tax of ₹60.99 crore and net profit of ₹45.53 crore, with EPS of ₹30.05. Net profit represented approximately 8.76% of total income, while the profit-before-tax margin was approximately 11.74%. The company's business mix includes performance polymers and chemicals, P&K fertilizers and agri nutrients, with performance polymers and chemicals being a significant segment. Earlier financial disclosures also showed growth in the company's performance polymers and chemicals segment, making segment-level revenue, margins and demand important future monitoring points. (NSE India Archives)
Technical View
The daily chart shows a sharp recovery from the recent ₹1,750.00-₹1,900.00 zone, followed by a strong upward move above ₹2,200.00. The current price is above the 50-day SMA of ₹1,936.02, indicating a significant change in the recent price structure. RSI 14 has risen to 71.60, moving above the commonly monitored 70 level and reflecting elevated short-term momentum. Volume of approximately 145.15 thousand shares accompanied the move. The stock also traded between ₹1,895.50 and ₹2,284.60 during the session, showing a wide intraday range and heightened volatility.
Key Technical Levels
Immediate support is around ₹1,931.30, corresponding to the session opening level. Next support is near ₹1,895.50, the day's low, followed by the 50-day SMA at ₹1,936.02 as a broader reference level. Immediate resistance is around ₹2,284.60, the latest intraday high. Next resistance is near ₹2,400.00, based on the previous visible chart zone.
Risks to Watch
- Elevated RSI indicates stretched short-term momentum.
- Sharp price movements could result in increased volatility.
- Future earnings may differ from the latest quarterly performance.
- Fertilizer and chemical demand can influence segment-level results.
- Input costs and operating margins remain important for future profitability.
Summary
Jubilant Agri and Consumer Products Limited (NSE: JUBLCPL) recorded a sharp market move after reporting its June 2026 quarterly performance, with the stock rising 17.02% to ₹2,265.00. The company reported total income of ₹519.48 crore, profit before tax of ₹60.99 crore and net profit of ₹45.53 crore, while EPS stood at ₹30.05. Technically, the stock is above its 50-day SMA of ₹1,936.02, while RSI at 71.60 indicates elevated momentum. Future monitoring will focus on earnings sustainability, segment performance, margins, demand conditions, trading volumes and price behaviour around the latest technical levels.
FAQs
Q: What were Jubilant Agri and Consumer Products' Q1 FY27 results?
A: The company reported total income of ₹519.48 crore, profit before tax of ₹60.99 crore and net profit of ₹45.53 crore, with EPS of ₹30.05.
Q: Why did JUBLCPL shares rise sharply?
A: The stock gained 17.02% following the company's latest quarterly performance, which showed positive profitability.
Q: What is Jubilant Agri's 50-day SMA?
A: The 50-day SMA shown on the supplied chart is ₹1,936.02.
Q: What does the RSI reading indicate?
A: RSI 14 is at 71.60, indicating elevated short-term momentum and a reading above the commonly monitored 70 level.
Q: What should investors monitor?
A: Investors should monitor quarterly earnings, segment performance, margins, input costs, trading volumes and price behaviour around ₹1,931.30, ₹1,895.50 and ₹2,284.60.