
Highlights
- Apar Industries shares surged 6.14 percent and touched a new annual high.
- The stock has delivered nearly 79 percent returns in 2026 so far.
- Five-year returns exceed 2,700 percent, outperforming the broader market.
Shares of Apar Industries Limited (NSE:APARINDS) gained 6.14 percent on June 11, 2026, with the stock trading at INR 14,896.00, up INR 865 .00 from the previous close of INR 14,085.00.
The stock opened at INR 14,065.00 and climbed steadily during the session to touch a fresh 52-week high of INR 14,925.00. The intraday low stood at INR 14,025.00, while the volume-weighted average price (VWAP) was INR 14,619.89. The latest move places the stock at its highest level in the past year and continues a strong upward trend witnessed over recent months.
Stock Delivers Significant Outperformance
Apar Industries has substantially outperformed the NIFTY 500 across all major timeframes. Over the last week, the stock gained 8.58 percent compared with a decline of 1.21 percent in the NIFTY 500. During the past month, Apar Industries advanced 15.90 percent, while the benchmark index fell 2.50 percent.
The year-to-date return stood at 78.75 percent against a decline of 7.04 percent in the NIFTY 500. On a one-year basis, the stock delivered returns of 83.05 percent, significantly ahead of the benchmark's negative return of 4.76 percent.
The longer-term performance has been even more notable, with returns of 390.46 percent over three years and 2,716.20 percent over five years.
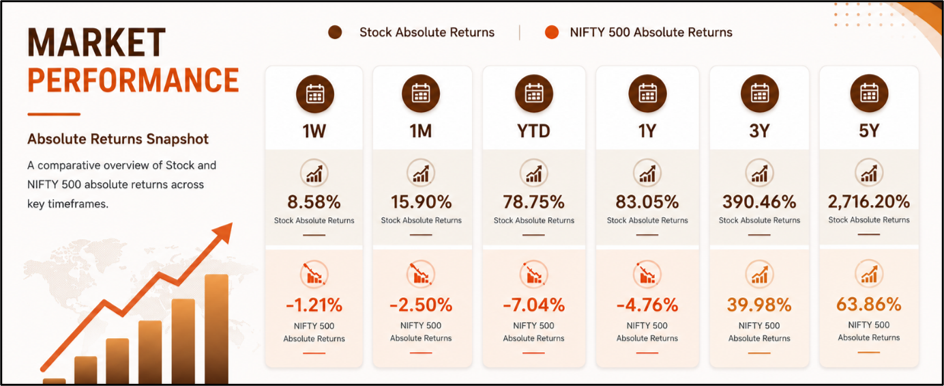
Source: NSE
Fresh High Caps Remarkable Recovery
The stock's latest 52-week high of INR 14,925.00 comes after it had fallen to a 52-week low of INR 6,801.00 on January 21, 2026.
From that low, the stock has more than doubled in value within less than five months. The recovery highlights the significant momentum witnessed in the counter during 2026.
Exchange data also indicates that the stock experienced a high-low price variation exceeding 100 percent during the previous six months, underscoring the magnitude of recent price movements.
Trading Volumes Remain Active
Apar Industries recorded traded volume of 2.46 lakh shares, resulting in traded value of INR 359.81 crore during the session.
The company had a total market capitalisation of INR 59,790.54 crore, while free-float market capitalisation stood at INR 25,070.75 crore.
The percentage of deliverable quantity to traded quantity was reported at 36.41 percent, indicating a combination of delivery-based buying and trading activity. The stock's impact cost remained low at 0.04, reflecting liquidity despite its elevated share price.
Valuation and Volatility Under Watch
Exchange disclosures indicate that Apar Industries' price-to-earnings ratio remains above 50 based on the previous four trailing quarters. The stock reported daily volatility of 2.95 percent and annualised volatility of 56.36 percent, suggesting that investors may continue to witness sizeable price swings.
The upper circuit limit for the stock stands at INR 16,902.00, while the lower circuit limit is INR 11,268.00. Given the sharp appreciation in recent months, market participants are likely to continue tracking valuation metrics, earnings performance and sector developments.
About Apar Industries
Apar Industries Limited operates across multiple business segments, including conductors, transformer and specialty oils, and power and telecommunications cables.
The company serves utility, industrial and infrastructure sectors in domestic as well as international markets. Its products are used across transmission and distribution networks, power infrastructure projects and industrial applications.
Key Risks
- High valuation levels may increase sensitivity to earnings growth.
- Commodity price fluctuations can impact operating margins.
- Infrastructure spending cycles may affect business demand.
- Elevated volatility could result in sharp market price movements.
Share Performance Today
Apar Industries shares traded at INR 14,950 on June 11, 2026, up INR 865 .00 or 6.14 percent from the previous close of INR 14,085.00. The stock touched a fresh 52-week high of INR 14,925.00 and a low of INR 14,025.00 during the session. Traded value stood at INR 359.81 crore, while market capitalisation reached approximately INR 59,790.54 crore.
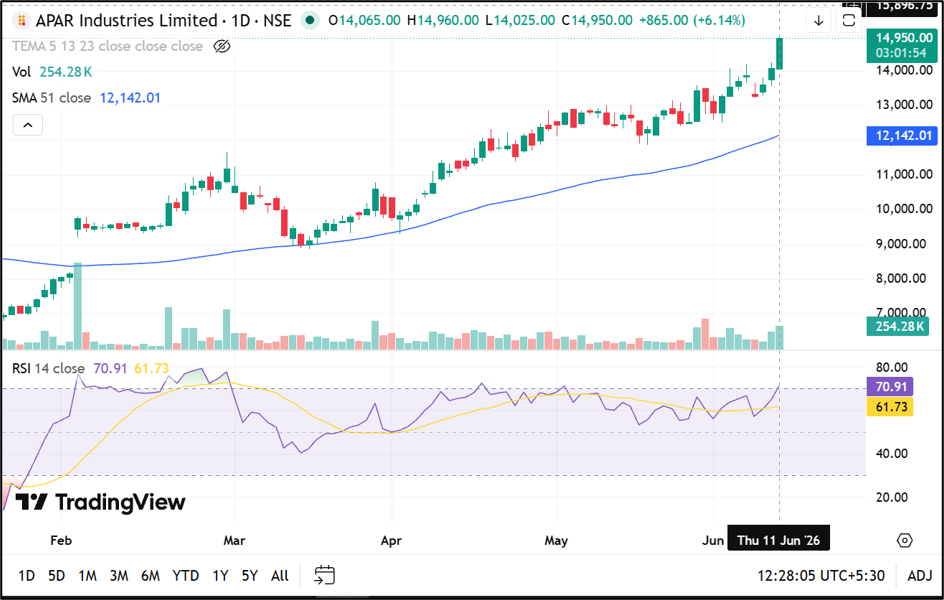
Source: TradingView
Summary
Apar Industries (NSE:APARINDS) remained among the notable gainers on June 11, 2026, after rising 6.14 percent and touching a fresh 52-week high of INR 14,925.00. The stock has generated returns of 78.75 percent on a year-to-date basis and more than 83 percent over the past year. Long-term performance has been particularly significant, with five-year returns exceeding 2,700 percent. Investors are likely to continue monitoring valuation levels, volatility and future business developments.
FAQs
Q: What is the latest 52-week high of Apar Industries shares?
A: Apar Industries touched a fresh 52-week high of INR 14,925.00 on June 11, 2026.
Q: How much has Apar Industries gained in 2026 so far?
A: The stock has delivered a year-to-date return of 78.75 percent.
Q: What are Apar Industries' five-year returns?
A: The stock has generated returns of approximately 2,716.20 percent over five years.