

Highlights
- Info Edge shares declined more than 4 percent during Monday’s trading session.
- The stock touched a fresh 52-week low amid continued market selling pressure.
- One-year and year-to-date returns lagged benchmark NIFTY MIDCAP 50 index performance.
Shares of Info Edge (India) Limited (NSE:NAUKRI) declined 4.15 percent to INR 921.10 on 25 May 2026 during active trading. The stock opened at INR 964.45 and touched an intraday high of INR 969.35 before falling sharply to a low of INR 908.30.
The day’s low also marked a fresh 52-week low for the stock. The previous closing price stood at INR 960.95, while the volume weighted average price was reported at INR 920.15.
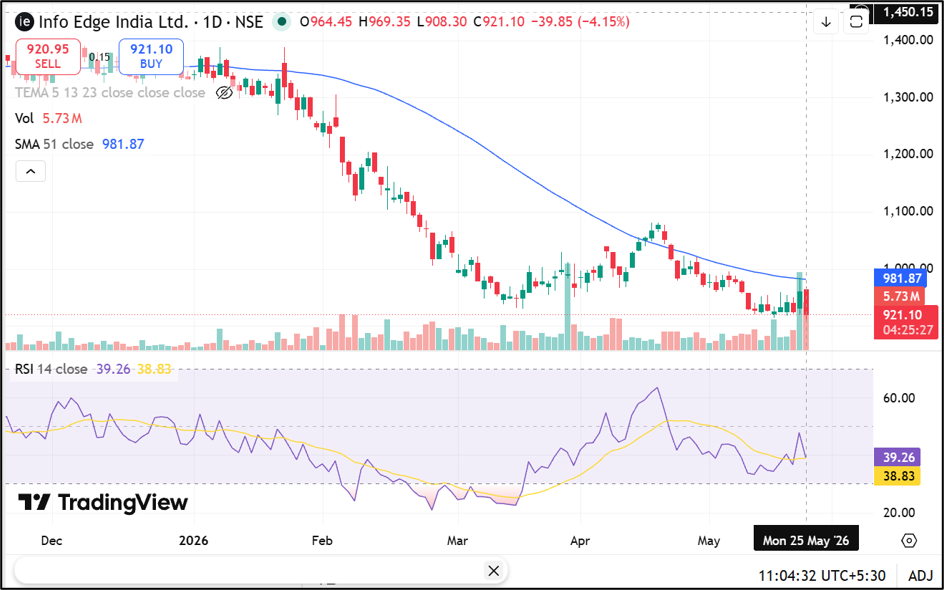
Source: Trading View
Trading Volumes And Market Activity
Trading activity remained elevated with traded volume reaching 57.18 lakh shares during the session. Traded value stood at INR 526.17 crore. The company’s total market capitalisation was reported at INR 59,719.54 crore, while free float market capitalisation stood at INR 35,105.86 crore.
Deliverable quantity as a percentage of traded quantity came at 54.49 percent, reflecting notable delivery-based participation. The stock continued trading in the EQ series and also remained available in derivatives, option chain and SLB segments.
Performance Lags Benchmark Index
Info Edge underperformed the NIFTY MIDCAP 50 index across multiple periods. The stock declined 0.60 percent over one week, while the benchmark index gained 2.11 percent. Over one month, the stock fell 6.55 percent compared with a 5.28 percent rise in the benchmark.
Year-to-date returns stood at negative 31.36 percent against a positive return of 1.63 percent in the benchmark index. On a one-year basis, the stock declined 38.19 percent, while the benchmark gained 10.98 percent. Longer-term returns showed gains of 17.99 percent over three years and 5.88 percent over five years, though both remained below benchmark performance.
Volatility And Price Range Indicators
The stock’s 52-week high stood at INR 1,550.00 recorded on 10 June 2025. Monday’s intraday low of INR 908.30 marked the new 52-week low.
Daily volatility for the stock was reported at 1.87, while annualised volatility stood at 35.73. Impact cost remained low at 0.03, indicating comparatively higher liquidity levels. The applicable margin rate for the stock stood at 15.40 percent. The stock traded without a fixed daily price band restriction.
Key Risks Investors May Monitor
- Continued selling pressure may affect short-term stock performance.
- Stock remains significantly below its 52-week high levels.
- Benchmark underperformance could influence broader market sentiment.
- Volatile technology sector trends may impact valuation movements.
Summary
Info Edge (India) (NSE:NAUKRI) shares declined more than 4 percent on 25 May 2026 and touched a fresh 52-week low during active market trade. The stock underperformed the NIFTY MIDCAP 50 index across several timeframes, including year-to-date and one-year periods. Trading activity remained elevated with over INR 526 crore worth of shares changing hands during the session.
FAQs
Q: Why did Info Edge shares decline on 25 May 2026?
A: The stock fell amid active selling pressure and broader underperformance against benchmark indices.
Q: What was Info Edge’s 52-week low during Monday’s session?
A: The stock touched a fresh 52-week low of INR 908.30 during trading.
Q: How did Info Edge perform against the NIFTY MIDCAP 50 index?
A: The stock underperformed the benchmark across one-month, year-to-date and one-year periods.