

Highlights
- GE Vernova T&D India traded marginally higher after witnessing sharp intraday price swings.
- The stock has delivered over 86% returns in one year despite recent short-term weakness.
- The company reported standalone March 2026 quarterly financial results in May.
GE Vernova T&D India Ltd. (NSE:GEVTD) traded marginally higher during the morning session on July 8, with the stock rising 0.07% to INR 4,443.80 as of 10:10 AM IST.
The stock opened at INR 4,375.00 and moved between an intraday low of INR 4,340.00 and a high of INR 4,508.00, reflecting elevated volatility during the session. The previous closing price stood at INR 4,440.80, while the volume-weighted average price (VWAP) was INR 4,450.63.
Trading Activity and Market Snapshot
Around 1.94 lakh shares changed hands during the session, generating a traded value of approximately INR 86.27 crore. The order book reflected 37.31% buy quantity against 62.69% sell quantity, indicating relatively higher selling interest during the trading session.
GE Vernova T&D India had a total market capitalisation of INR 1.14 lakh crore, while its free-float market capitalisation stood at INR 54,913.42 crore.
The company is part of the Nifty LargeMidcap 250 index and operates in the heavy electrical equipment industry.
The stock is currently under LT ASM-1 (Long-Term Additional Surveillance Measure). The applicable margin rate stands at 100%.
Stock Performance Across Timeframes
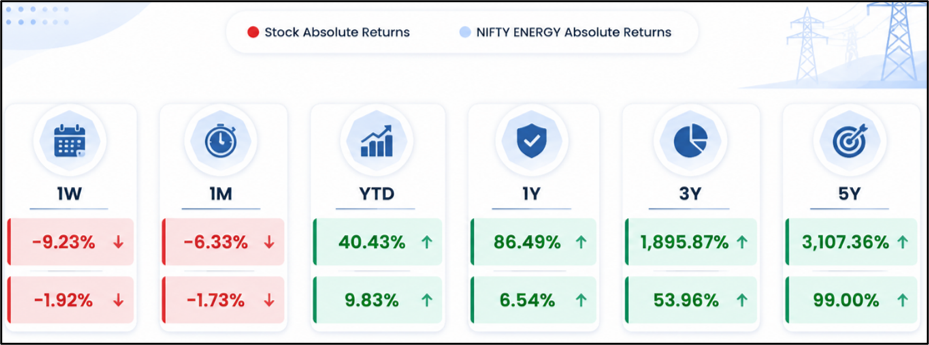
GE Vernova T&D India has delivered mixed returns across different investment periods. The stock declined 9.23% over the past week and 6.33% during the last month, underperforming the Nifty Energy index, which declined 1.92% and 1.73%, respectively.
Despite the recent weakness, the stock has gained 40.43% on a year-to-date basis, significantly outperforming the benchmark index's return of 9.83%. Over the past year, the stock has advanced 86.49%, compared with a 6.54% gain in the Nifty Energy index. The stock has also generated returns of 1,895.87% over three years and 3,107.36% over five years.
Source: Analysis by Kalkine
March 2026 Quarter Financial Results
For the quarter ended March 31, 2026, GE Vernova T&D India reported unaudited standalone total income of INR 1,67,424 lakh. Profit before tax stood at INR 46,873 lakh, while net profit was INR 35,177 lakh. Earnings per share (EPS) for the quarter came in at INR 13.74.
The company released its unaudited standalone financial results on May 18, 2026. For the quarter ended December 31, 2025, standalone total income was INR 1,71,939 lakh, while profit before tax stood at INR 38,971 lakh. Net profit for that quarter was INR 29,080 lakh, with EPS of INR 11.36.
Valuation and Trading Metrics
GE Vernova T&D India is trading at a symbol P/E ratio of 92.20, while the adjusted P/E stands at 88.94.
The stock has traded within a 52-week range of INR 2,265.00 to INR 5,650.00. Its 52-week high was recorded on June 23, 2026, while the 52-week low was touched on July 14, 2025. Daily volatility stands at 2.92%, while annualised volatility is 55.79%, reflecting relatively high price fluctuations.
Key Risks
- High valuation could increase sensitivity to earnings disappointments.
- Project execution delays may affect revenue recognition.
- Rising input costs could pressure operating margins.
- Elevated volatility may result in sharp short-term price movements.
Summary
GE Vernova T&D India traded marginally higher on July 8 after witnessing significant intraday volatility. Although the stock has declined over the past week and month, it continues to post substantial gains over one year, three years and five years. The company also reported unaudited standalone financial results for the March 2026 quarter, while the stock remains under the LT ASM-1 surveillance framework.
FAQs
Q: What was GE Vernova T&D India's share price on July 8, 2026?
A: The stock traded at INR 4,443.80, up 0.07% from the previous closing price during the morning session.
Q: Why is GE Vernova T&D India under LT ASM-1?
A: LT ASM-1 is an exchange surveillance measure aimed at monitoring stocks based on specified market parameters.
Q: What was GE Vernova T&D India's EPS for the March 2026 quarter?
A: The company reported standalone earnings per share of INR 13.74 for the quarter ended March 31, 2026.