
Highlights
- MMP Industries stock rises 10.72 percent, touching its 52-week high level.
- One-month returns exceed 37 percent, outperforming NIFTY 50 benchmark index.
- FY26 net profit reported at ₹1,152.60 lakh with EPS of ₹4.50 on consolidated basis.
Shares of MMP Industries Limited (NSE:MMP) traded at ₹294.10 on May 5, 2026, gaining 10.10percent from the previous close of ₹267.43. The stock opened at ₹267.43 and moved within a range of ₹267.43 to ₹319.98 during the session.
The intraday high of ₹319.98 marks its 52-week high, reflecting strong buying interest. Trading volumes stood at 5.15 lakh shares, with a traded value of ₹15.33 crore. The VWAP was recorded at ₹297.88, indicating stable execution across price levels.
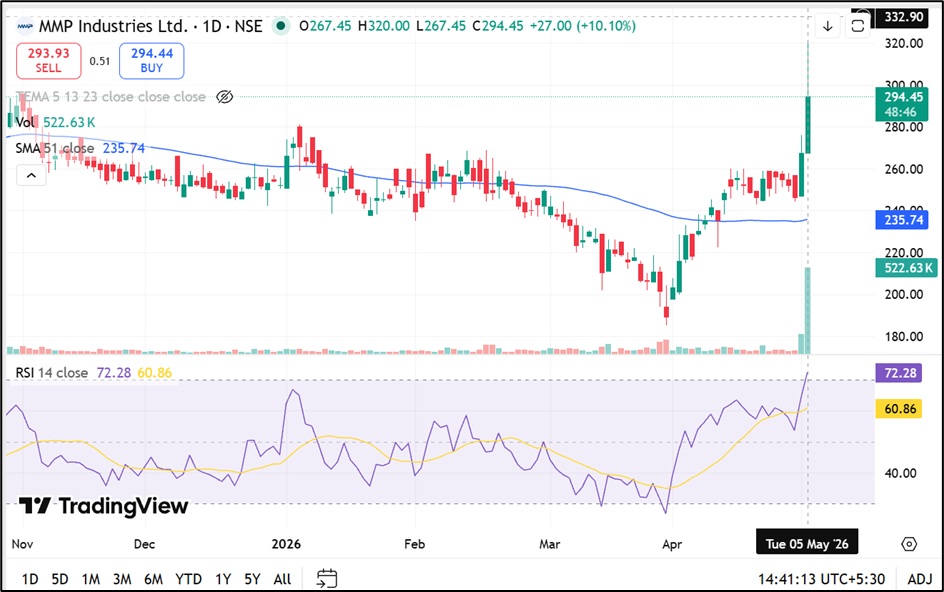
Source: TradingView
Returns Performance: Sharp Short-Term Momentum
MMP Industries has shown strong performance across timeframes. The stock gained 16.30 percent over one week and 37.13 percent over the past month, significantly outperforming the NIFTY 50 index.
Year-to-date returns stand at 11.35 percent, while one-year returns are at 22.03 percent. Over longer periods, the stock has delivered 57.18 percent returns over three years and 230.31 percent over five years.
Financial Performance: December 2025 Snapshot
For the quarter ended December 31, 2025, the company reported consolidated total income of ₹20,389.67 lakh. Profit before tax stood at ₹1,179.10 lakh, while net profit was ₹1,152.60 lakh, with earnings per share of ₹4.50.
On a standalone basis, total income was ₹20,336.46 lakh, while net profit stood at ₹981.43 lakh with EPS of ₹3.86. These figures represent reported financial performance without adjustments or forecasts.
Market Metrics and Liquidity Indicators
The company has a total market capitalisation of ₹752.65 crore, with a free float market cap of ₹191.96 crore. The impact cost is relatively high at 0.47, indicating lower liquidity compared to larger stocks.
Deliverable quantity stood at 40.17 percent of traded volume, suggesting a relatively higher proportion of delivery-based trading activity.
Volatility and Trading Conditions
The stock recorded daily volatility of 2.73 percent and annualised volatility of 52.16 percent, indicating moderate-to-high price fluctuations. The applicable margin rate is 21.86 percent.
MMP Industries operates within a 20 percent price band, with an upper band of ₹320.91 and a lower band of ₹213.95. The tick size is ₹0.01.
Key Risks
- Small free-float market cap may lead to higher price swings.
- Elevated impact cost indicates lower liquidity in trading.
- High volatility may result in sharp intraday fluctuations.
- Strong recent rally increases possibility of short-term correction.
Summary
MMP Industries (NSE:MMP) shares surged over 10 percent, reaching a fresh 52-week high amid strong buying interest. The stock has delivered robust short-term returns, outperforming benchmark indices. FY26 financials show steady profitability, while volatility and liquidity constraints indicate potential risks for traders and investors.
FAQs
- Why did MMP Industries stock rise today?
The stock gained due to strong momentum, high short-term returns, and increased buying activity during the session. - What are MMP Industries’ latest financial results?
The company reported FY26 consolidated net profit of ₹1,152.60 lakh with EPS of ₹4.50. - Is MMP Industries stock liquid?
Liquidity is moderate to low, reflected by higher impact cost and small free-float market capitalisation.