
Highlights
- ideaForge stock hits 10 percent upper circuit, touching fresh 52-week high levels.
- One-month returns surge over 100 percent, significantly outperforming NIFTY 50 benchmark index.
- Stock flagged under ASM-1 with zero EPS based on trailing four quarters.
Shares of ideaForge Technology Limited (NSE:IDEAFORGE) traded at ₹804.10 on May 5, 2026, rising 10.00 percent from the previous close of ₹731.00. The stock opened at ₹751.00 and moved within a range of ₹745.15 to ₹804.10, eventually locking at the upper circuit limit.
The current price also marks its 52-week high, indicating sustained buying interest during the session. Trading volumes stood at 99.09 lakh shares, with a traded value of ₹773.34 crore. The VWAP was recorded at ₹780.43, reflecting consistent activity before the circuit filter was hit.
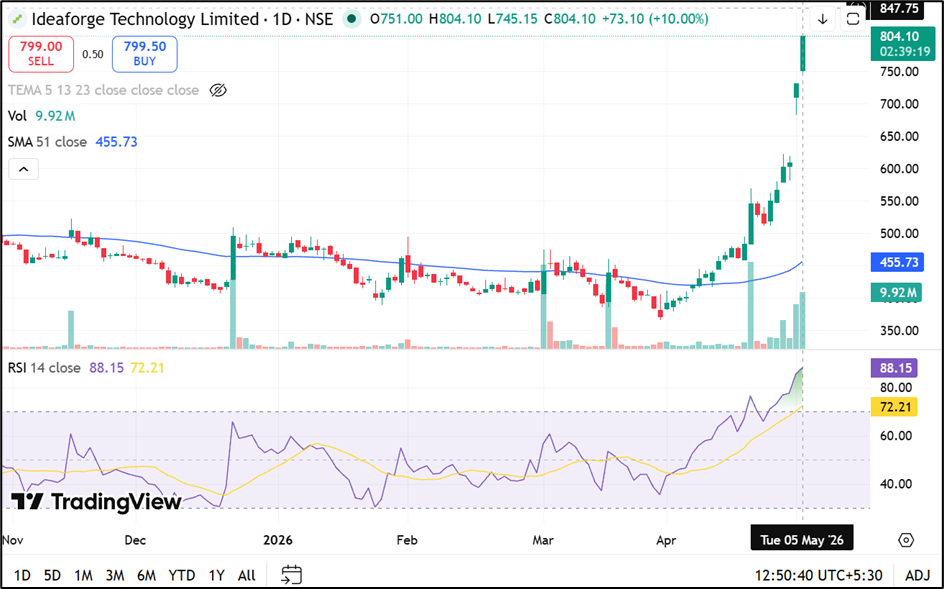
Source: TradingView
Returns Performance: Sharp Rally Across Periods
ideaForge has recorded significant gains across timeframes. The stock surged 41.78 percent in one week and 102.95 percent over the past month, far exceeding benchmark performance.
Year-to-date returns stand at 73.24 percent, while one-year returns are at 109.16 percent. These figures highlight a rapid upward movement in the stock compared to the broader NIFTY 50 index, which showed limited changes over similar periods.
Market Metrics and Liquidity Indicators
The company’s total market capitalisation stands at ₹3,479.82 crore, with a free float market cap of ₹1,823.03 crore. The impact cost is relatively higher at 0.09, suggesting moderate liquidity compared to larger-cap stocks.
Deliverable quantity accounted for 22.66 percent of total traded volume, indicating a higher proportion of trading activity relative to delivery-based participation.
Volatility and Trading Conditions
The stock exhibits a daily volatility of 3.50 percent and an annualised volatility of 66.87 percent, reflecting sharp price fluctuations. The applicable margin rate is elevated at 50.00 percent, indicating higher risk perception in trading.
ideaForge operates within a 10 percent price band, with the upper band at ₹804.10 and lower band at ₹657.90. The tick size is ₹0.05.
Regulatory and Valuation Indicators
The stock is currently under ASM-1 classification, which indicates enhanced surveillance measures. Additionally, the earnings per share based on the previous four trailing quarters is reported as zero, reflecting absence of reported earnings during that period.
Key Risks
- Zero EPS over trailing quarters indicates absence of earnings visibility.
- High volatility exposes investors to rapid price fluctuations.
- ASM-1 classification signals increased regulatory monitoring.
- Sharp short-term rally raises possibility of price corrections.
Summary
ideaForge (NSE:IDEAFORGE) shares hit the 10 percent upper circuit, reaching a new 52-week high amid strong buying momentum. The stock has delivered sharp gains across short- and medium-term periods, significantly outperforming benchmark indices. However, zero EPS, high volatility, and ASM classification indicate elevated risks, suggesting cautious interpretation of the recent price movement.
FAQs
- Why did ideaForge stock hit upper circuit?
ideaForge stock surged due to strong momentum, high trading activity, and significant short-term gains across multiple timeframes. - What does ASM-1 classification mean for ideaForge?
ASM-1 indicates enhanced regulatory surveillance due to volatility or unusual price movements in the stock. - Is ideaForge a high-risk stock currently?
Yes, high volatility, zero EPS, and sharp rally indicate elevated risk levels for traders and investors.