

Highlights
- Ashapura Minechem reported standalone total income of ₹115.65 crore for the June 2026 quarter.
- Profit before tax stood at ₹33.48 crore, while net profit reached ₹24.78 crore.
- The stock fell 9.68% to ₹666.85 after opening at ₹660.00.
- The share touched an intraday high of ₹678.60 and a low of ₹642.60.
- Trading volume stood at 1.47 million shares, while VWAP was ₹662.70.
- Investors should monitor earnings sustainability, margins, commodity demand and the stock's reaction around the 50-day SMA.
Overview
Ashapura Minechem Limited (NSE: ASHAPURMIN) operates across minerals and related products, with its business performance influenced by mineral demand, commodity prices and industrial activity. The stock declined 9.68% to ₹666.85 on August 10, 2026, after opening at ₹660.00. It touched a high of ₹678.60 and a low of ₹642.60, while VWAP stood at ₹662.70. The decline followed the company's recently reported June 2026 quarter results, which showed standalone total income of ₹115.65 crore and net profit of ₹24.78 crore. The market reaction came alongside a sharp intraday trading range and elevated volume.
Fundamental View
For the quarter ended June 30, 2026, Ashapura Minechem reported standalone total income of ₹115.65 crore, profit before tax of ₹33.48 crore and net profit of ₹24.78 crore. Earnings per share stood at ₹2.59. The latest figures provide a fresh view of the company's operating performance and profitability. Going forward, revenue growth, margins and the sustainability of earnings will remain important areas to monitor. Mineral demand, commodity price movements, export conditions, input costs and broader industrial activity can also influence the company's financial performance in subsequent quarters.
Technical View
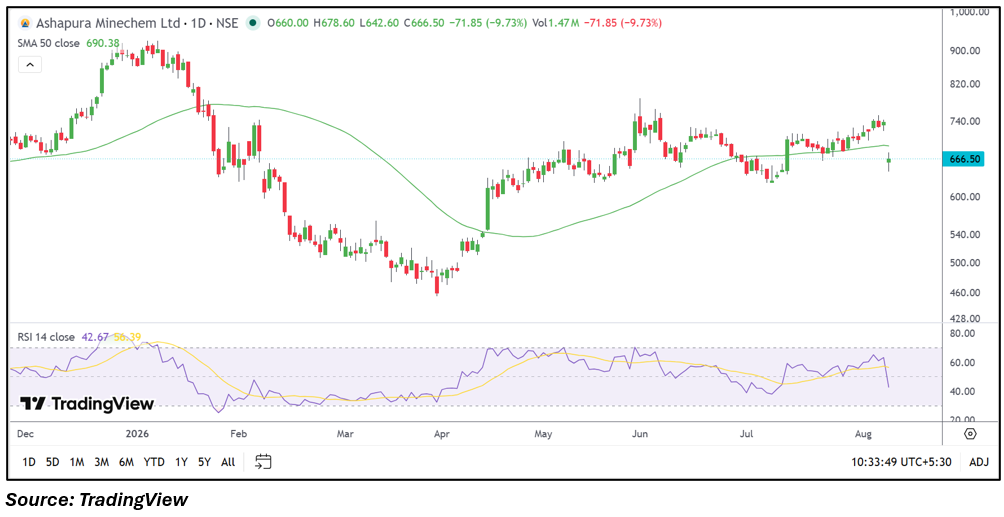
The daily chart shows the stock undergoing a sharp one-session decline after recently trading in the ₹700-₹740 region. The latest price of ₹666.85 is below the 50-day SMA of ₹690.38, putting the moving average back into focus for the near-term price structure. RSI 14 has fallen to 42.67 from higher levels in recent sessions, indicating weaker momentum without entering the conventional oversold zone. The session's range between ₹642.60 and ₹678.60 highlights elevated volatility. Trading volume of 1.47 million shares also indicates active participation during the decline.
Key Technical Levels
Immediate support is around ₹642.60, based on the latest intraday low. Next support is near ₹620.00, followed by the earlier price area around ₹600.00. Immediate resistance is around ₹690.38, corresponding to the 50-day SMA. Next resistance is near ₹738.35, the previous close and recent upper trading zone. These levels provide reference points for monitoring the stock's evolving price structure.
Risks to Watch
- Mineral and commodity price fluctuations can affect revenue and profitability.
- Changes in industrial demand may influence volumes and business performance.
- Input and logistics costs can affect operating margins.
- A sustained move below the 50-day SMA could alter the short-term technical structure.
- Future quarterly results will be important for assessing the consistency of earnings.
Summary
Ashapura Minechem (NSE: ASHAPURMIN) reported June quarter total income of ₹115.65 crore, profit before tax of ₹33.48 crore and net profit of ₹24.78 crore, with EPS at ₹2.59. Despite the latest financial update, the stock declined 9.68% to ₹666.85 and traded below its 50-day SMA of ₹690.38. RSI at 42.67 reflects softer momentum, while the ₹642.60 intraday low highlights the session's volatility. Going forward, investors should monitor earnings consistency, margins, mineral demand, commodity prices and the stock's behaviour around its key technical levels.
FAQs
Q: What were Ashapura Minechem's June quarter results?
A: Ashapura Minechem reported total income of ₹115.65 crore, profit before tax of ₹33.48 crore and net profit of ₹24.78 crore for the June 2026 quarter.
Q: What was Ashapura Minechem's EPS in Q1 FY27?
A: The company's reported earnings per share for the June 2026 quarter was ₹2.59.
Q: Why did Ashapura Minechem shares fall on August 10, 2026?
A: The stock declined 9.68% during the session amid heightened market activity and a sharp change in its recent price structure following the latest quarterly update.
Q: What is the 50-day SMA for ASHAPURMIN?
A: The 50-day SMA shown on the daily chart is ₹690.38, while the stock was trading at ₹666.85.
Q: What should investors monitor in Ashapura Minechem?
A: Investors should monitor quarterly earnings, margins, mineral demand, commodity prices, input costs and price behaviour around the stock's key technical levels.