
Highlights
- Butterfly Gandhimathi Appliances shares declined 3.97%, continuing to trade below its broader trend.
- The stock holds above its 50-day SMA near ₹ 613.31, acting as a key support level.
- RSI at 54.14 reflects mixed momentum with limited directional strength.
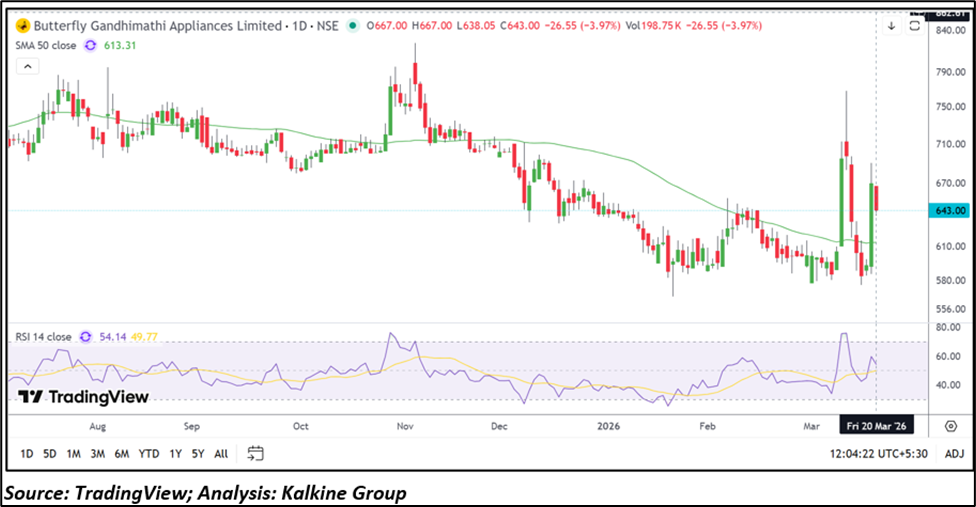
Butterfly Gandhimathi Appliances Limited (NSE:BUTTERFLY) is trading around ₹ 643.00, down approximately 3.97% as of March 20, 2026. The stock continues to trade below its broader trend trajectory despite holding above its 50-day simple moving average near ₹ 613.31, which serves as an important support level. The price structure reflects a continuation of the broader downtrend, with intermittent pullbacks failing to sustain at higher levels.
Sector Context and Industry Trends
The company operates in the consumer appliances sector, which is influenced by household demand, income levels, and seasonal buying patterns. The industry typically responds to changes in consumer sentiment, product innovation, and distribution reach. Growth in kitchen and home appliances is supported by urbanization and evolving consumer lifestyles, although competition and pricing pressure remain key considerations.
Financial Overview
Specific financial figures are not included in the latest update. However, stock performance in the consumer appliances segment is generally influenced by revenue growth, cost efficiency, and product demand. Companies in this space are often evaluated based on margins, sales volume, and brand positioning in competitive markets.
Volume and Trading Activity
The stock’s recent decline has been accompanied by ongoing trading activity, indicating continued participation from market participants. Price movement with consistent volume can reflect sustained selling pressure, though confirmation depends on further price action and volume trends over time.
Technical Analysis
Butterfly Gandhimathi Appliances Limited is trading around ₹643.00, down 3.97% as of March 20, 2026, and continues to trade below its broader trend trajectory despite holding above its 50-day SMA near ₹613.31, which remains a key support reference. The price structure reflects a continuation of the broader downtrend, with intermittent pullbacks failing to sustain at higher levels.
Momentum remains mixed, with the RSI at 54.14, indicating limited strength. Immediate support is placed near ₹600.00 and ₹560.00, while resistance is seen near ₹690.00 and ₹730.00, where upside attempts may face near-term hurdles.
Outlook Considerations
The current price structure indicates that the stock remains within a broader downtrend, with short-term pullbacks not yet confirming a reversal. Sustaining above key support levels will be important for price stability. Market participants may monitor sector demand, competition, and company-specific developments to assess future direction.
Risk Factors
- Continued weakness within a broader downtrend
- Limited momentum and failure to sustain higher price levels
- Sensitivity to consumer demand and economic conditions
- Risk of decline if support levels are breached
Conclusion
Butterfly Gandhimathi Appliances Ltd is trading lower while maintaining support above its 50-day moving average. The stock continues to reflect a broader downtrend, with mixed momentum and defined support and resistance levels. Future price direction will depend on whether the stock can break resistance or sustain above key support zones.
Butterfly Gandhimathi Appliances shares declined 3.97% to ₹ 643.00 while remaining above the 50-day SMA near ₹ 613.31. The stock continues in a broader downtrend with mixed momentum as RSI stands at 54.14. Support is placed near ₹ 600 and ₹ 560, while resistance levels are observed around ₹ 690 and ₹ 730, limiting upside attempts.
FAQs
- Why did Butterfly Gandhimathi Appliances stock fall recently?
The stock declined due to continued weakness within a broader downtrend and inability to sustain higher levels. - What are the key technical levels for the stock?
Support is near ₹ 600 and ₹ 560, while resistance levels are placed around ₹ 690 and ₹ 730. - What does the RSI indicate?
The RSI at 54.14 indicates neutral momentum with limited directional strength and no extreme conditions.