

Highlights
- CIE Automotive India shares declined more than 7% after announcing Q1 FY27 earnings.
- Consolidated total income stood at ₹2,649.20 crore during the quarter.
- Net profit came in at ₹235.62 crore, while EPS was ₹6.18.
- The stock emerged among the top losers on the NSE.
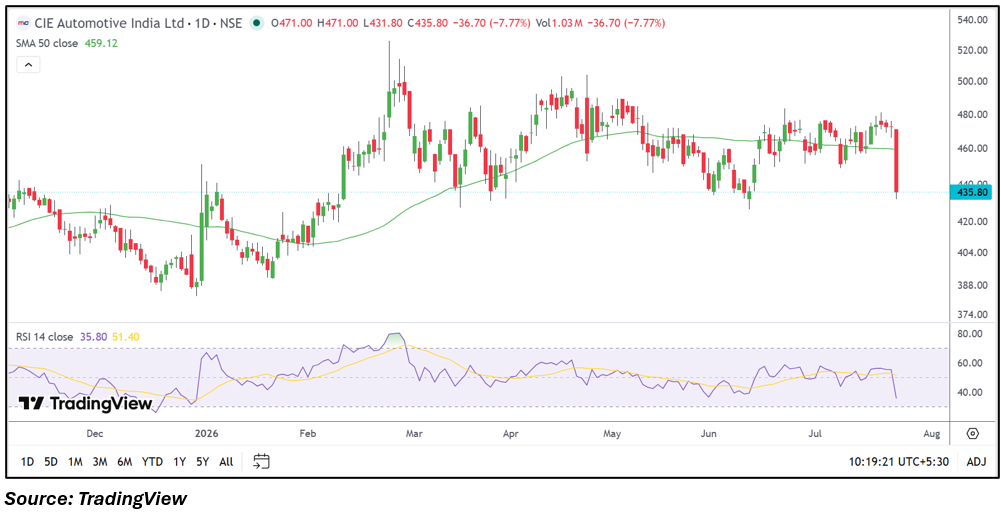
- Shares slipped below the 50-day moving average following the post-results decline.
- Investors are assessing the quarterly performance and future business outlook.
Overview
CIE Automotive India Limited manufactures automotive components for passenger vehicles, commercial vehicles, and two-wheelers across domestic and international markets. The company's shares declined more than 7% during Thursday's trading session after announcing its Q1 FY27 earnings. The stock touched an intraday low of ₹431.80 before trading near ₹436.25, as market participants reacted to the quarterly results.
Fundamental View
For the quarter ended 30 June 2026, CIE Automotive India reported consolidated total income of ₹2,649.20 crore. Profit before tax stood at ₹311.06 crore, while net profit was ₹235.62 crore. Earnings per share came in at ₹6.18. The company continues to benefit from its diversified manufacturing footprint and broad customer base across the automotive sector. Going forward, vehicle production trends, export demand, raw material costs, operating margins, and customer order inflows will remain key factors influencing financial performance.
Technical View
CIE Automotive India witnessed a sharp correction following the quarterly earnings announcement. The stock slipped below its 50-day moving average of ₹459.12, indicating a weakening in the medium-term technical structure. The 14-day RSI declined to around 35.80, reflecting softer momentum after the recent selloff. Price action suggests investors may monitor whether the stock stabilises around current levels before establishing its next directional move.
Key Technical Levels
Immediate support is placed near ₹431.80, followed by the next support around ₹420.00. On the upside, immediate resistance is seen near ₹471.00, while the next resistance is positioned around ₹485.00. These levels may remain important for the stock's near-term price movement.
Risks to Watch
- Slowdown in global and domestic automobile demand.
- Fluctuations in steel and other raw material prices.
- Supply chain disruptions.
- Currency movements affecting export earnings.
- Margin pressure due to higher manufacturing costs.
Summary
CIE Automotive India came under pressure after reporting its Q1 FY27 earnings, with the stock declining more than 7% during Thursday's trading session. While the company continues to maintain a diversified presence in the automotive components industry, investors are likely to monitor demand trends, profitability, operating margins, export performance, and future quarterly results to gauge the company's growth trajectory.
FAQs
Q: Why did CIE Automotive India shares fall after Q1 FY27 earnings?
A: The stock declined as investors reacted to the company's quarterly earnings announcement.
Q: What was CIE Automotive India's total income in Q1 FY27?
A: The company reported consolidated total income of ₹2,649.20 crore.
Q: How much net profit did CIE Automotive India report in Q1 FY27?
A: The company reported consolidated net profit of ₹235.62 crore.
Q: What does the technical outlook indicate?
A: The stock is trading below its 50-day moving average with weaker momentum following the post-results decline.
Q: What should investors monitor going forward?
A: Investors should monitor automobile demand, raw material costs, operating margins, export performance, customer orders, and future quarterly earnings.