
Highlights
- CLSEL shares surged nearly 12% and entered the NSE top gainers list.
- The stock moved above its 50-day SMA amid increased trading activity.
- Strong FY26 earnings and profitability remain key factors in focus.
Overview
Chaman Lal Setia Exports Limited (NSE: CLSEL) attracted significant market attention on June 12 after its shares climbed 11.69% to ₹296.10. The stock emerged among the top gainers on the NSE as investors reacted positively to its recent price momentum and healthy financial performance.
The rally pushed the stock above the psychologically important ₹290 level and closer to its recent highs, while trading volumes remained elevated compared with normal sessions.
Fundamental View
Chaman Lal Setia Exports reported a solid financial performance for the quarter ended March 2026. The company posted standalone total income of ₹43,235.77 lakh, while profit before tax stood at ₹5,153.69 lakh.
Net profit came in at ₹3,826.50 lakh, with earnings per share of ₹7.70. The profitability profile distinguishes the company from many small and mid-cap stocks that have recently experienced price-driven rallies without corresponding earnings support.
Investors appear to be focusing on the company’s ability to maintain profitability while benefiting from its presence in the rice export and food products segment.
Technical View
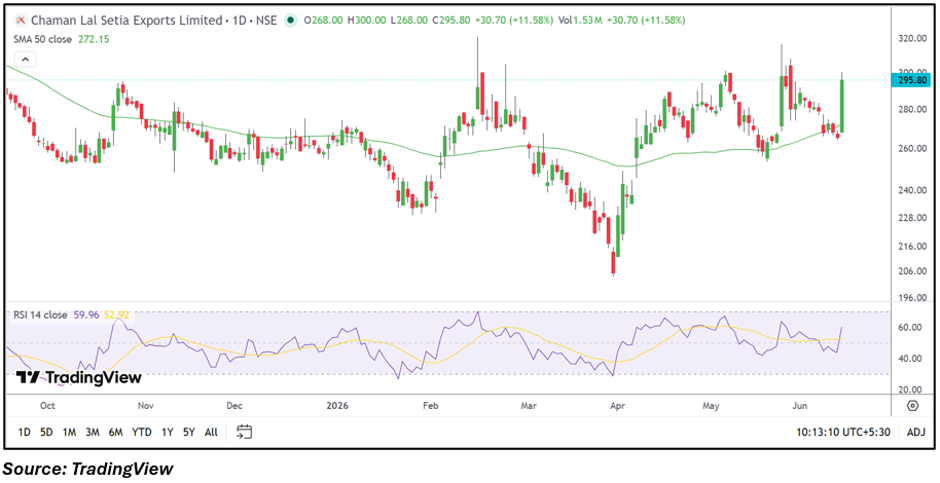
CLSEL is currently trading at ₹296.10 after gaining 11.69% during the session. The stock has moved above its 50-day SMA of ₹272.15, indicating an improvement in the near-term trend structure.
Price action shows a decisive breakout from the recent consolidation range, with buyers pushing the stock toward the ₹300 mark. The latest move also places the stock near the upper end of its recent trading band, highlighting renewed momentum.
Momentum Indicator
The RSI is hovering near 59.96 and has moved above its signal line, reflecting improving momentum conditions. The indicator remains below extreme levels, suggesting the rally has strengthened momentum without yet reaching heavily stretched territory.
Key Technical Levels
CLSEL is trading comfortably above its 50-day SMA of ₹272.15, which may serve as an important support zone during any short-term consolidation. On the upside, the stock is testing the ₹300.00 region after today's sharp rally. A sustained move above this zone could keep the positive momentum intact, while a pullback below the 50-day SMA could weaken the current recovery structure.
Risks to Watch
- Commodity price fluctuations may affect margins.
- Export demand can remain sensitive to global conditions.
- Profit-booking after a sharp rally may increase volatility.
- Currency movements could influence earnings performance.
Summary
Chaman Lal Setia Exports has entered the NSE top gainers list after a nearly 12% surge in its share price. The move has been supported by profitable FY26 financials, a breakout above the 50-day SMA, and improving momentum indicators. Investors will now watch whether the stock can sustain its strength near the ₹300 level while maintaining earnings growth.
FAQs
Why did CLSEL shares rise today?
The stock gained sharply due to strong momentum, elevated trading activity, and investor focus on recent earnings performance.
How profitable was CLSEL in the latest quarter?
The company reported a standalone net profit of ₹3,826.50 lakh for the quarter ended March 2026.
What technical level is important for CLSEL?
The 50-day SMA near ₹272.15 remains a key support area, while ₹300 is an important upside level.