
Highlights
- Coffee Day Enterprises shares declined over 5% after a sharp rally in recent sessions.
- The stock remains above its 50-day SMA despite the latest profit-booking phase.
- RSI continues to hold in elevated territory, indicating momentum remains constructive.
Overview
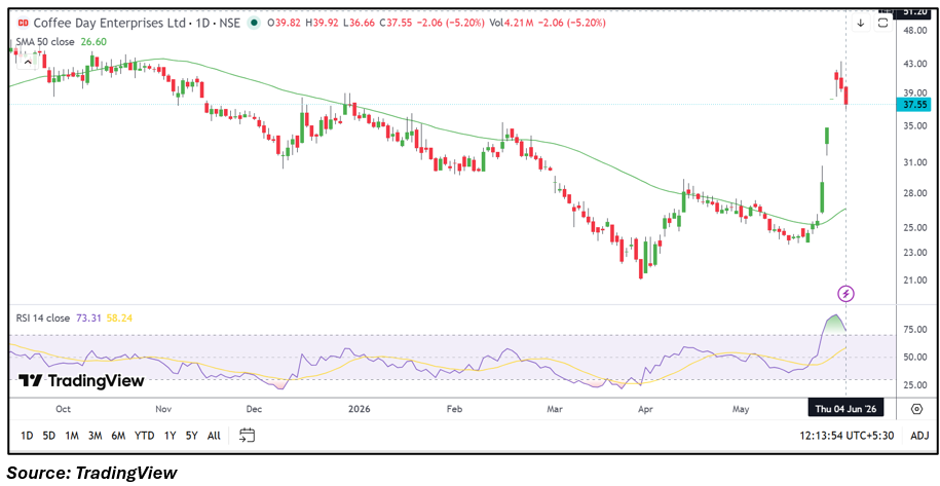
Coffee Day Enterprises (NSE: COFFEEDAY) fell 5.25% to INR 37.53 on June 4 as investors booked profits following a strong breakout-led rally. The stock had surged significantly over recent sessions and approached the INR 40 mark before witnessing selling pressure. Despite the correction, the broader technical structure remains improved compared with levels seen earlier this year.
Fundamental View
For the quarter ended March 2026, Coffee Day Enterprises reported standalone total income of INR 465.80 crore. The company reported profit before tax of INR 13,049.80 lakh and net profit of INR 13,049.80 lakh, while earnings per share stood at INR 6.18.
The return to profitability has improved sentiment around the stock. However, investors are likely to continue monitoring the sustainability of earnings and operational performance in upcoming quarters.
Technical View
COFFEEDAY is currently trading at INR 37.53, comfortably above its 50-day SMA of INR 26.60, reflecting an improved near-term technical structure. Recent price action shows the stock undergoing a pullback after a sharp breakout rally that lifted it from the mid-INR 20 range to near INR 40.
The 14-day RSI stands at 73.31, remaining above the 70 mark despite the latest decline. This suggests momentum remains positive, although the stock may continue to experience short-term volatility following its recent advance.
Momentum Indicator
Momentum remains constructive as the RSI continues to trade in elevated territory. While the latest correction has cooled the pace of the rally, the indicator suggests that the broader upward momentum has not completely faded.
Key Technical Levels
Based on the current market price of INR 37.53, immediate support is placed near INR 35.65, while a stronger support zone is seen around INR 33.78. On the upside, the stock may face immediate resistance near INR 39.41, with the next resistance level positioned around INR 41.28. A sustained move above the resistance zone could support further upside momentum, while a break below support levels may increase near-term selling pressure.
Risks to Watch
- Profit booking after the recent sharp rally.
- Elevated volatility due to strong price swings.
- Sustainability of earnings improvement.
- Failure to hold above key support levels.
Summary
Coffee Day Enterprises witnessed a notable correction after a powerful breakout rally, with the stock declining more than 5% during the session. Despite the pullback, the stock remains well above its 50-day SMA and continues to exhibit positive momentum characteristics. Support levels near INR 35.65 and INR 33.78 will be important to watch, while resistance levels are seen around INR 39.41 and INR 41.28. The broader trend remains constructive as long as the stock sustains above key support zones.
FAQs
Why did Coffee Day Enterprises shares fall today?
The stock declined as traders booked profits after a sharp breakout-led rally in recent sessions.
Is the broader trend still positive for COFFEEDAY?
The stock remains above its 50-day SMA and continues to hold elevated momentum readings.
What are the key levels to watch?
Support is placed near INR 35.65 and INR 33.78, while resistance is located near INR 39.41 and INR 41.28.