

Highlights
- AVRO India Limited is trading at ₹8.71, down 7.14% from the previous close of ₹9.38.
- June 2026 total income stood at ₹2,526.81 lakh, with profit before tax of ₹75.25 lakh and net profit of ₹68.72 lakh.
- The stock opened at ₹9.48, touched a high of ₹9.48 and declined to an intraday low of ₹8.43.
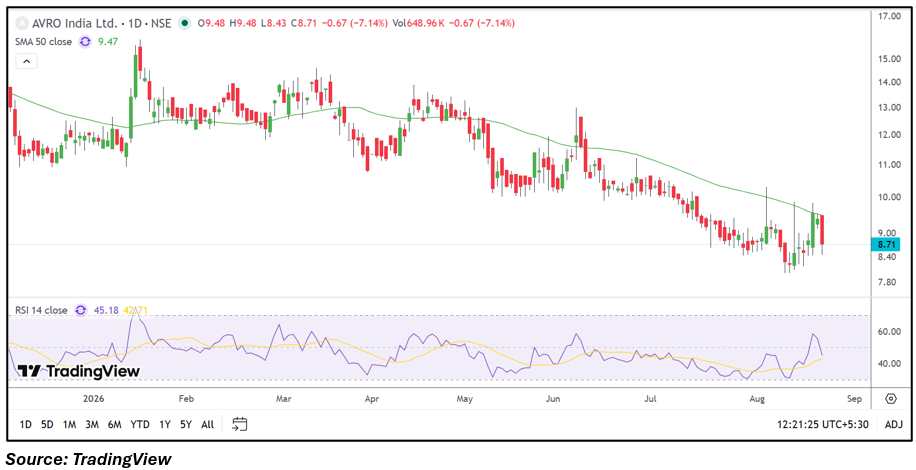
- The price is below the 50-day SMA of ₹9.47, while RSI at 45.18 reflects moderated short-term momentum.
- Trading volume has reached 648.96 thousand shares, with the current session showing a wide intraday range.
- Investors should monitor the ₹8.43 area, the ₹9.47 moving average, volume behaviour and upcoming financial results.
Overview
AVRO India Limited (NSE: AVROIND) is engaged in the manufacturing and sale of plastic furniture and related products. The stock is trading at ₹8.71, compared with the previous close of ₹9.38, after opening at ₹9.48 and recording the same level as its intraday high before declining to ₹8.43. The stock is currently down 7.14%, while its VWAP stands at ₹8.82. Trading volume has reached 648.96 thousand shares, reflecting active participation during the session. The daily chart shows that the stock recently attempted to recover from lower levels but faced resistance around the ₹9.40 to ₹9.50 region. The latest decline has brought the price back below the 50-day SMA, keeping the technical structure under observation.
Fundamental View
For the quarter ended June 2026, AVRO India Limited reported total income of ₹2,526.81 lakh, profit before tax of ₹75.25 lakh and net profit of ₹68.72 lakh. Earnings per share stood at ₹0.05. The reported profit before tax margin was approximately 2.98%, while the net profit margin was around 2.72%. The quarterly numbers indicate that the company remained profitable during the period, although margins remain an important factor for future performance. Investors can monitor revenue growth, raw-material costs, operating expenses, profit margins and EPS in subsequent quarters. Demand for plastic furniture, competitive conditions and broader consumption trends may also influence the company's future operating performance.
Technical View
The daily chart shows a broader declining structure, with the stock remaining below its 50-day SMA of ₹9.47. The recent rebound carried the price toward the moving-average region before the latest session reversed lower. RSI 14 is currently at 45.18, below the neutral 50 mark, indicating that short-term momentum has moderated following the recent recovery attempt. The current session opened at ₹9.48 and moved down to ₹8.43, creating a relatively wide trading range. Volume of 648.96 thousand shares accompanies the decline, while the price remains below the moving average. The interaction between ₹8.43 and the ₹9.47 SMA will therefore remain relevant for the evolving chart structure.
Key Technical Levels
Immediate support is around ₹8.43, corresponding to the current session low, while the next support area is near ₹8.00 based on the recent price structure. Immediate resistance is around ₹9.38 to ₹9.48, where the previous close and latest opening and high levels are positioned. The next resistance is near ₹10.00, followed by the ₹10.50 to ₹11.00 region visible on the broader daily chart. These levels should be evaluated alongside changes in volume and momentum.
Risks to Watch
- A sustained move below ₹8.43 could weaken the recent recovery structure.
- The stock remains below its 50-day SMA of ₹9.47.
- RSI below 50 indicates moderated short-term momentum.
- Changes in raw-material costs could affect operating margins.
- Future revenue and profitability may vary with demand and competitive conditions.
Summary
AVRO India Limited (NSE: AVROIND) is currently trading below its 50-day SMA after a recent recovery attempt encountered resistance around the ₹9.40 to ₹9.50 region. The June 2026 quarter reported total income of ₹2,526.81 lakh, profit before tax of ₹75.25 lakh, net profit of ₹68.72 lakh and EPS of ₹0.05. Technically, RSI at 45.18 indicates moderated momentum, while the latest decline has increased attention around ₹8.43 support and ₹9.47 resistance represented by the 50-day SMA. Future quarterly financial performance, margins, volume behaviour and price action around these technical levels remain important areas to monitor.
FAQs
Q: What is the latest share price of AVRO India Limited?
A: AVRO India Limited was trading at ₹8.71 according to the latest market data provided.
Q: What was AVRO India Limited's net profit in June 2026?
A: The company reported net profit of ₹68.72 lakh for the quarter ended June 2026.
Q: What is the 50-day SMA of AVRO India Limited?
A: The 50-day SMA shown on the daily chart is ₹9.47.
Q: What is the current RSI of AVRO India Limited?
A: The RSI 14 reading shown on the chart is 45.18.
Q: Which technical levels are important for AVRO India Limited?
A: The ₹8.43 area is an immediate support level, while ₹9.38 to ₹9.48 represents an immediate resistance zone. The ₹9.47 50-day SMA is also an important technical reference.
`