

Highlights
- Precision Wires India declined 6.59% to ₹428.00 in the August 19 session.
- June 2026 total income stood at ₹1,779.24 crore, with net profit at ₹46.45 crore.
- The stock opened at ₹458.00 and touched an intraday low of ₹425.10.
- Price remains above the 50-day SMA of ₹399.71 despite the latest decline.
- Trading volume stood at 694.62K shares, while VWAP was ₹434.49.
- Investors should monitor the ₹425.10 zone, 50-day SMA, recent highs and RSI movement.
Overview
Precision Wires India Limited (NSE: PRECWIRE) manufactures winding wires and related products used across electrical and industrial applications. On August 19, 2026, the stock opened at ₹458.00 and remained at the session high of ₹458.00 before declining to an intraday low of ₹425.10. The current price was ₹428.00, down ₹30.20 or 6.59%, while VWAP stood at ₹434.49. The stock has experienced a strong upward move over the broader chart period, but the latest session represents a notable retreat from the recent higher price zone. The market reaction is therefore centred on whether the stock can hold its recent trading range following the decline.
Fundamental View
For the quarter ended June 30, 2026, Precision Wires India reported standalone total income of ₹1,779.24 crore, profit before tax of ₹61.89 crore and net profit of ₹46.45 crore. Earnings per share stood at ₹2.54. The reported profit before tax margin was approximately 3.48%, while the net profit margin was approximately 2.61%. The company's financial performance remains linked to demand from electrical and industrial customers, copper prices, operating costs, product volumes and broader infrastructure and power-sector activity. Future monitoring points include revenue growth, margin stability, raw-material price movements, capacity utilisation and the sustainability of quarterly earnings.
Technical View
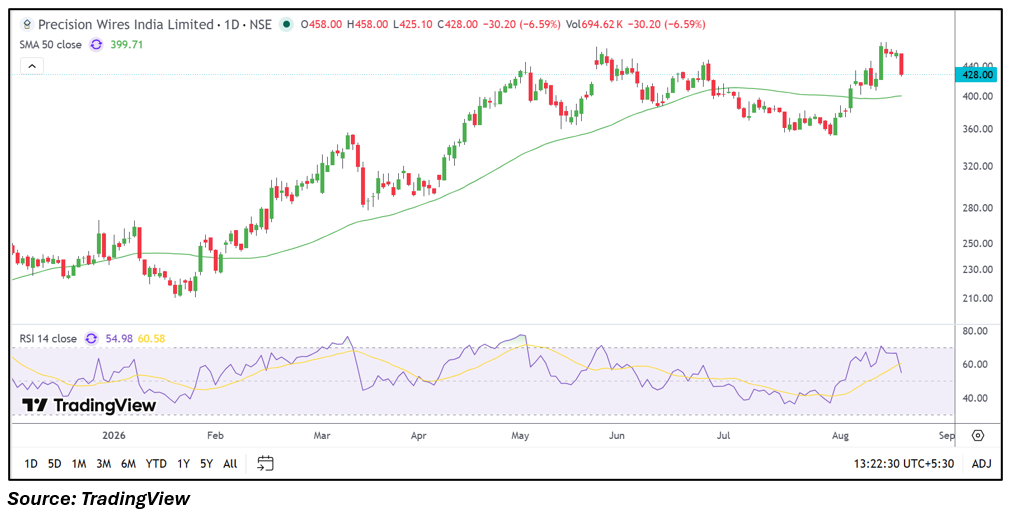
The daily chart shows Precision Wires India trading above its 50-day SMA of ₹399.71, although the latest decline has reduced short-term momentum. The stock opened at ₹458.00 and fell close to the session low of ₹425.10, producing a sizeable red candle. RSI 14 stands at 54.98, indicating that momentum has moved closer to the neutral zone after recently reaching higher levels. Trading volume of 694.62K shares accompanies the decline, while the price is below the VWAP of ₹434.49. The broader price structure remains above the 50-day average, but the latest candle indicates increased short-term volatility.
Key Technical Levels
The ₹425.10 area is the latest visible intraday low and an important near-term reference point. Below this level, the ₹400.00 region aligns closely with the 50-day SMA of ₹399.71, while the ₹360.00 area represents another visible historical trading zone on the chart. On the upside, ₹434.49 corresponds with the current VWAP, followed by ₹458.20, which is the previous closing level and today's opening area. The recent higher trading zone around ₹470.00-₹480.00 also remains visible on the chart.
Risks to Watch
- A sustained move below ₹425.10 could weaken the recent price structure.
- Volatility remains elevated following the stock's earlier upward movement.
- Copper and other raw-material price fluctuations could affect margins.
- Changes in electrical and industrial demand may influence revenue growth.
- Large price movements can increase short-term uncertainty around valuation.
Summary
Precision Wires India is witnessing a notable pullback, with the stock declining 6.59% to ₹428.00 after opening at ₹458.00 and touching ₹425.10. The broader chart remains above the 50-day SMA of ₹399.71, while RSI at 54.98 indicates a moderation in momentum. June 2026 total income stood at ₹1,779.24 crore, with net profit of ₹46.45 crore and EPS of ₹2.54. Future monitoring will focus on earnings growth, margins, raw-material costs, trading volumes and the stock's behaviour around the visible ₹425.10, ₹399.71 and ₹458.20 levels.
FAQs
Q: Why is Precision Wires India stock down today?
A: Precision Wires India declined 6.59% in the observed session, falling from ₹458.00 at the open to an intraday low of ₹425.10.
Q: What was Precision Wires India's net profit in June 2026?
A: The company reported standalone net profit of ₹46.45 crore for the quarter ended June 30, 2026.
Q: What is the 50-day SMA of Precision Wires India?
A: The 50-day SMA shown on the daily chart is ₹399.71.
Q: What is the RSI of PRECWIRE stock?
A: The RSI 14 reading shown on the chart is 54.98.
Q: Which price levels are visible for Precision Wires India?
A: The latest low of ₹425.10 is a key near-term reference, while ₹399.71 and around ₹360.00 are lower visible zones. On the upside, ₹434.49 and ₹458.20 are visible reference levels.