

Highlights
- Creative Newtech shares gained 13.50% to ₹891.25 during Thursday's session.
- The stock touched a fresh intraday high of ₹899.00 with strong trading activity.
- The company reported profitable standalone results for the March 2026 quarter.
- The stock continued trading above its 50-day moving average.
- RSI entered the higher zone, reflecting sustained short-term momentum.
- Investors are monitoring whether the stock can hold above its recent breakout range.
Overview
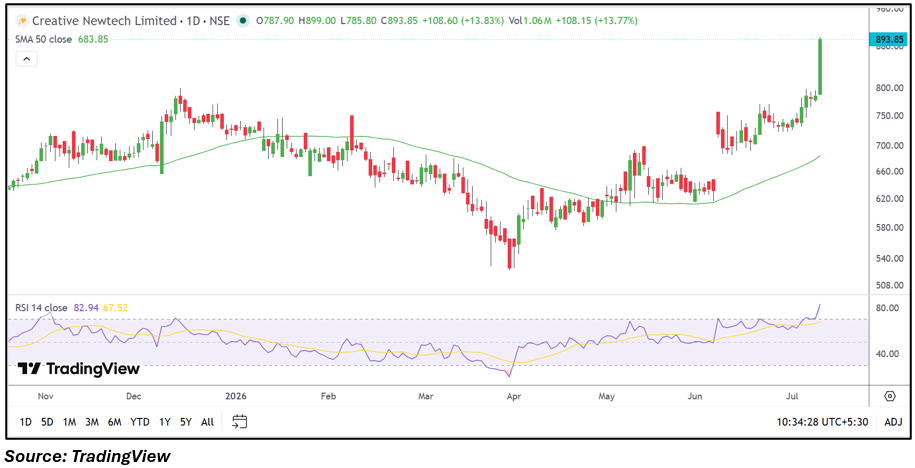
Creative Newtech Limited emerged among the day's top-performing stocks after its shares climbed 13.50% to ₹891.25. The stock opened at ₹787.90 and advanced to an intraday high of ₹899.00, supported by increased trading volumes. The latest move extends the stock's recent upward trend as market participants evaluate the company's financial performance alongside its improving technical setup.
Fundamental View
For the quarter ended 31 March 2026, the company reported standalone total income of ₹71,835.63 lakh. Profit before tax stood at ₹1,633.23 lakh, while net profit came in at ₹1,240.04 lakh. Earnings per share were reported at ₹8.26. The latest quarterly performance reflects continued profitability, with investors likely to monitor demand across technology products, distribution partnerships, operating margins, and future business expansion.
Technical View
Creative Newtech is trading comfortably above its 50-day moving average of ₹683.85, indicating that the medium-term trend remains favourable. The 14-day RSI climbed to around 82.94, reflecting elevated momentum following the recent breakout. Trading volumes strengthened during the session, highlighting increased market participation. Price action around the recent highs will remain an important indicator of the stock's near-term direction.
Key Technical Levels
Immediate support is placed near ₹870.00, followed by the next support around ₹845.00. On the upside, immediate resistance is seen near ₹899.00, while the next resistance is positioned around ₹925.00. These levels may influence the stock's next directional move.
Risks to Watch
- Changes in enterprise technology spending.
- Pressure on operating margins.
- Supply chain disruptions.
- Currency fluctuations affecting imported products.
- Overall market volatility.
Summary
Creative Newtech extended its recent rally with a double-digit gain, pushing the stock to fresh highs during the session. The latest quarterly results reflected continued profitability, while the technical structure remains constructive with the stock trading well above its 50-day moving average. Investors are likely to monitor future earnings, business expansion, and price action around important technical levels.
FAQs
Q: Why did Creative Newtech shares rise over 13% today?
A: The stock advanced sharply on higher trading activity, improving market participation, and continued positive price momentum.
Q: How did Creative Newtech perform in the latest quarter?
A: For the quarter ended 31 March 2026, the company reported standalone total income of ₹71,835.63 lakh and net profit of ₹1,240.04 lakh.
Q: What does the current technical setup indicate?
A: The stock is trading above its 50-day moving average, while the RSI has moved into the higher zone, indicating sustained short-term momentum.
Q: What are the important technical levels to watch?
A: Immediate support is near ₹870.00 and ₹845.00, while resistance is placed around ₹899.00 and ₹925.00.
Q: What factors could influence Creative Newtech shares going forward?
A: Investors may watch future quarterly earnings, technology demand, distribution partnerships, operating margins, and broader market sentiment.