

Highlights
- Dwarikesh Sugar Industries is witnessing a sharp recovery after its recent August decline.
- June 2026 total income stood at ₹360.07 crore, while net loss was ₹25.73 crore.
- The stock opened at ₹44.86, touched ₹50.05 and recorded a low of ₹44.56.
- The price is trading above its 50-day SMA of ₹42.85, improving the short-term chart structure.
- Trading volume reached 6.09 million shares, with VWAP at ₹48.45.
- Investors should monitor sugar realizations, ethanol demand, margins, volumes and upcoming financial results.
Overview
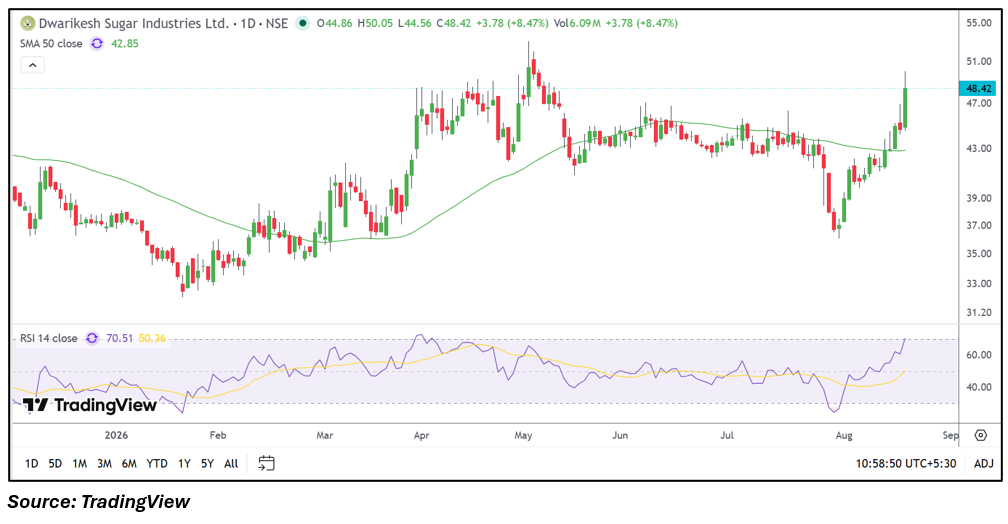
Dwarikesh Sugar Industries Limited (NSE: DWARKESH) operates in the sugar industry with activities spanning sugar manufacturing, ethanol and related businesses. On August 19, 2026, the stock opened at ₹44.86 and moved to a high of ₹50.05 before trading around ₹48.30, with the session low at ₹44.56. VWAP stood at ₹48.45 and volume reached 6.09 million shares. The movement follows a recovery from the ₹36.00-₹37.00 area seen during late July. The stock has subsequently moved above its 50-day SMA, while the broader sugar-stock segment remains sensitive to production conditions, sugar prices, ethanol demand and government policies.
Fundamental View
For the quarter ended June 30, 2026, Dwarikesh Sugar Industries reported standalone total income of ₹360.07 crore, while profit before tax was a loss of ₹34.38 crore. Net profit was a loss of ₹25.73 crore and earnings per share stood at negative ₹1.39. The June quarter reflects the seasonal nature of the sugar business, with operating performance influenced by sugar realizations, cane costs, inventory valuation and distillery activity. The latest numbers indicate that profitability remains an important monitoring point despite the recent improvement in the stock's market performance. Future results will provide further indications about margins, sugar sales, ethanol contribution, cane availability and the company's operating position.
Technical View
The daily chart shows a recovery from the late-July decline, with the stock moving from around ₹36.00 to the ₹48.00-₹50.00 zone. The 50-day SMA currently stands at ₹42.85, and the market price remains above this average, indicating a change in the recent price structure. RSI 14 is at 70.51, showing elevated momentum and a reading around the overbought zone. Recent trading volume of 6.09 million shares is also significant compared with several earlier sessions. The stock is now testing the ₹50.00 region, making the behaviour around this area important for assessing whether the recovery can sustain.
Key Technical Levels
Immediate support is visible around ₹45.00, followed by the 50-day SMA near ₹42.85. A deeper support zone can be observed around ₹39.00-₹40.00 based on the recent recovery structure. Immediate resistance is around ₹50.05, which corresponds with the current session high, while the next resistance zone is near ₹51.00-₹52.00, where previous swing activity was visible. These levels can help track whether the recent recovery continues or enters another consolidation phase.
Risks to Watch
- The June 2026 quarter reported a net loss of ₹25.73 crore.
- Sugar prices and cane procurement costs can affect operating margins.
- Ethanol demand and production levels remain important for diversification of revenue.
- RSI at 70.51 indicates elevated momentum and potential for increased volatility.
- Failure to sustain levels above the 50-day SMA could weaken the recent recovery structure.
Summary
Dwarikesh Sugar Industries is showing a notable recovery on the daily chart, with the stock trading above its 50-day SMA of ₹42.85 after rebounding from the late-July decline. The latest session recorded a high of ₹50.05 and volume of 6.09 million shares, while RSI at 70.51 reflects elevated momentum. Fundamentally, the June 2026 quarter remained challenging, with total income of ₹360.07 crore, a profit-before-tax loss of ₹34.38 crore and a net loss of ₹25.73 crore. Going forward, sugar realizations, cane costs, ethanol activity, margins, quarterly earnings and the sustainability of the current technical structure remain important factors to monitor.
FAQs
Q: What was Dwarikesh Sugar Industries' total income in June 2026?
A: Dwarikesh Sugar Industries reported standalone total income of ₹360.07 crore for the quarter ended June 30, 2026.
Q: What was the net profit of Dwarikesh Sugar Industries in June 2026?
A: The company reported a net loss of ₹25.73 crore for the quarter ended June 30, 2026.
Q: What is the 50-day SMA of DWARKESH?
A: The 50-day SMA shown on the daily chart is ₹42.85.
Q: What is the RSI of Dwarikesh Sugar Industries?
A: The 14-day RSI is 70.51, indicating elevated momentum and a reading around the overbought zone.
Q: Which technical levels should be monitored for DWARKESH?
A: The ₹45.00 and ₹42.85 areas can be monitored as support zones, while ₹50.05 and ₹51.00-₹52.00 represent important resistance areas.