
Highlights
- Fineotex Chemical hit the lower circuit after a steep correction from recent highs.
- Despite the decline, the stock remains above its 50-day SMA of ₹27.68.
- RSI has cooled from overbought territory, reflecting fading short-term momentum.
Overview
Fineotex Chemical (NSE: FCL) came under heavy selling pressure on June 8, with the stock falling 9.99% to ₹36.66. The decline followed a powerful rally that had lifted the stock to a recent high of ₹42.48. The sharp pullback indicates profit-booking activity after a strong upward move, although the stock continues to trade well above its 50-day Simple Moving Average (SMA) of ₹27.68.
Fundamental View
Fineotex Chemical reported standalone total income of ₹10,501.27 lakh for the quarter ended March 2026. The company posted a profit before tax of ₹2,436.17 lakh and net profit of ₹2,113.50 lakh, while earnings per share stood at ₹0.18. The latest quarterly results indicate the company remained profitable during the reporting period.
Technical View
Fineotex Chemical is trading at ₹36.66 while remaining above its 50-day SMA of ₹27.68, suggesting the broader trend remains positive despite the sharp correction. Price action had witnessed a rapid advance during recent weeks before encountering selling pressure near recent highs. The 14-day RSI stands at 56.76 after retreating from elevated levels, indicating momentum has moderated but remains above the neutral zone. The latest decline may reflect short-term profit booking rather than a complete trend reversal.
Momentum Indicator
The RSI reading of 56.76 suggests momentum remains positive, though considerably lower than recent overbought readings. This indicates that bullish momentum has cooled and traders may be reassessing positions following the stock's rapid rise.
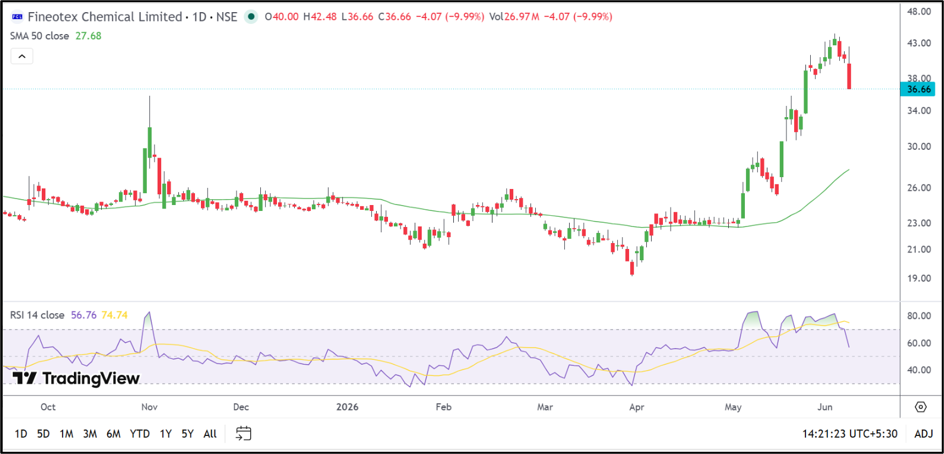
Source: TradingView
Key Technical Levels
Support is placed near ₹34.83 and ₹32.99.
Resistance is positioned near ₹38.49 and ₹40.33.
Key Risks to Watch
- Profit booking after the recent sharp rally.
- Increased volatility due to ASM surveillance measures.
- Failure to hold above near-term support zones.
- Margin pressure impacting future profitability.
Summary
Fineotex Chemical witnessed a sharp correction after a strong rally, with the stock hitting the lower circuit and falling to ₹36.66. While short-term momentum has weakened, the stock remains comfortably above its 50-day SMA of ₹27.68. The RSI at 56.76 suggests momentum remains constructive, though traders may watch whether the stock stabilizes following the recent bout of profit booking.
FAQs
- Why did Fineotex Chemical shares fall today?
The stock declined sharply as traders booked profits following a strong rally to recent highs. - Is the broader trend still positive for FCL?
The stock remains above its 50-day SMA, indicating the broader trend remains constructive. - What does the RSI indicate now?
The RSI has eased to 56.76, suggesting momentum remains positive but has cooled from overbought levels.