

Highlights
- GACM Technologies shares declined nearly 9% after a sharp rally in the previous trading session.
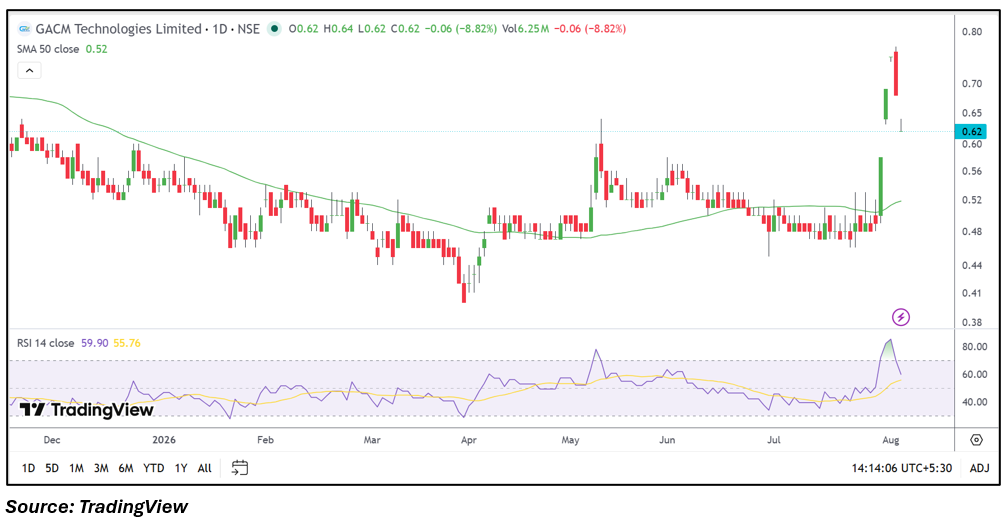
- The stock traded between ₹0.62 and ₹0.64 during Wednesday's session.
- The company reported a consolidated net profit of ₹165.85 lakh in its latest available results.
- Price continued to trade above the 50-day moving average despite the correction.
- The RSI eased from elevated levels following the recent rally.
- Investors will monitor whether the stock stabilizes after the sharp two-day swing.
Overview
GACM Technologies Limited (NSE: GATECH), a technology-focused company, witnessed profit booking after a sharp rally in the previous session. The stock declined nearly 9% to around ₹0.62 after trading in a narrow intraday range between ₹0.62 and ₹0.64. The latest correction follows heightened volatility over the last two sessions as market participants adjusted positions after the recent surge.
Fundamental View
Based on its latest available consolidated financial results for the quarter ended March 2026, GACM Technologies reported total income of ₹625.38 lakh. Profit before tax stood at ₹168.98 lakh, while net profit came in at ₹165.85 lakh with earnings per share of ₹0.01. Investors may continue tracking future financial updates, revenue growth, profitability trends and business execution as key indicators of the company's operational performance.
Technical View
Following a sharp upward move in the previous session, the stock witnessed a corrective decline, indicating profit booking after recent gains. Even after the pullback, the price remains above its 50-day moving average of ₹0.52, suggesting that the medium-term structure has improved compared with earlier levels. The 14-day RSI stood at 59.90 after easing from higher readings, reflecting moderation in momentum. Trading activity remained elevated, highlighting continued participation amid heightened volatility.
Key Technical Levels
Immediate support is placed near ₹0.62, followed by ₹0.58 if weakness extends. On the upside, immediate resistance is seen around ₹0.64, while the next resistance is positioned near ₹0.70. Price action around these levels may influence the stock's near-term direction.
Risks to Watch
- High price volatility.
- Liquidity-related fluctuations.
- Execution of future business plans.
- Changes in investor sentiment.
- Broad market movements affecting small-cap stocks.
Summary
GACM Technologies witnessed a sharp correction after a strong rally in the previous session, highlighting the volatile nature of the stock. While the latest available financials reflected profitability, investors are likely to monitor upcoming business developments, future quarterly performance and whether the stock maintains stability around current price levels.
FAQs
Q: Why did GACM Technologies shares fall nearly 9%?
A: The stock witnessed profit booking after a sharp rally in the previous trading session.
Q: What were GACM Technologies' latest reported revenue figures?
A: The company reported consolidated total income of ₹625.38 lakh in its latest available quarterly results.
Q: How much net profit did GACM Technologies report?
A: GACM Technologies reported consolidated net profit of ₹165.85 lakh.
Q: Is the stock trading above its 50-day moving average?
A: Yes, the stock continues to trade above its 50-day moving average of ₹0.52.
Q: What should investors monitor going forward?
A: Investors may watch future financial performance, business developments, trading volumes and the stock's movement around key technical levels.