

Highlights
- Galaxy Surfactants reported standalone total income of ₹1,272.29 crore for the June 2026 quarter.
- Profit before tax stood at ₹142.04 crore, while net profit reached ₹105.94 crore and EPS was ₹29.88.
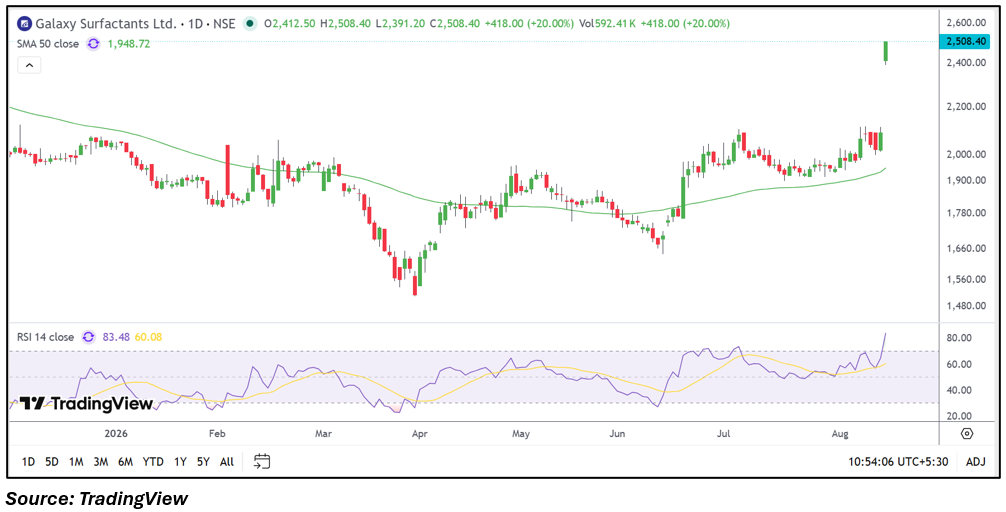
- The stock gained 20.00% to ₹2,508.40 during the August 14 session.
- The share price moved significantly above its 50-day SMA of ₹1,948.72 following the latest session move.
- Trading activity stood at 592.41 thousand shares, with VWAP at ₹2,499.89.
- Investors should monitor earnings consistency, margins, demand conditions and the stock's ability to sustain its elevated technical structure.
Overview
Galaxy Surfactants Limited operates in the specialty chemicals and surfactants segment, supplying ingredients used across personal care and other consumer-oriented applications. On August 14, 2026, the stock traded at ₹2,508.40, rising 20.00% from the previous close of ₹2,090.40. It opened at ₹2,412.50, touched a high of ₹2,508.40 and recorded a low of ₹2,391.20, while VWAP stood at ₹2,499.89. The sharp market movement came as investors assessed the company's latest June 2026 quarterly performance, which reported total income of ₹1,272.29 crore and net profit of ₹105.94 crore. The stock was among the top gainers during the session.
Fundamental View
For the quarter ended June 30, 2026, Galaxy Surfactants reported standalone total income of ₹1,272.29 crore, profit before tax of ₹142.04 crore and net profit of ₹105.94 crore, with earnings per share at ₹29.88. The profit before tax margin was approximately 11.17%, while the net profit margin stood at about 8.33%. The latest figures provide a reference for evaluating the company's operating performance and profitability across its specialty-chemicals portfolio. Future monitoring points include demand from personal-care markets, raw-material costs, product mix, export performance, currency movements and the consistency of margins across subsequent quarters.
Technical View
The daily chart shows a sharp upward move, with the stock reaching ₹2,508.40 and trading substantially above its 50-day SMA of ₹1,948.72. The price had been consolidating around the ₹1,900.00-₹2,100.00 region before the latest expansion. RSI 14 has jumped to 83.48, moving well above the conventional 70 level and indicating elevated momentum. Trading volume was 592.41 thousand shares, while VWAP stood at ₹2,499.89. The large price expansion has materially changed the short-term price structure, while subsequent sessions will indicate whether the stock can maintain the elevated levels.
Key Technical Levels
Immediate support is around ₹2,412.50, corresponding with the current session's opening level. The next support is near ₹2,090.40, around the previous close and recent price structure. Immediate resistance is around ₹2,508.40, the current session high, while the next resistance zone can be observed near ₹2,600.00 based on the chart's visible price scale. Price behaviour around these levels can provide indications about near-term consolidation and momentum.
Risks to Watch
- Elevated RSI may result in increased short-term price volatility.
- Raw-material costs could affect operating margins.
- Demand conditions across personal-care and specialty-chemical markets require monitoring.
- Currency movements may influence export-linked financial performance.
- Future quarterly results will determine whether the latest earnings performance remains consistent.
Summary
Galaxy Surfactants reported June 2026 total income of ₹1,272.29 crore, profit before tax of ₹142.04 crore and net profit of ₹105.94 crore, with EPS at ₹29.88. The stock subsequently gained 20.00% to ₹2,508.40, moving well above its 50-day SMA of ₹1,948.72. RSI at 83.48 indicates elevated momentum, while the stock's position substantially above its moving average reflects a major change in the short-term technical structure. Going forward, investors can monitor quarterly earnings, margins, demand conditions, raw-material costs, currency movements and price behaviour around the latest trading levels.
FAQs
Q: What did Galaxy Surfactants report in Q1 FY27?
A: Galaxy Surfactants reported standalone total income of ₹1,272.29 crore, profit before tax of ₹142.04 crore and net profit of ₹105.94 crore for the quarter ended June 30, 2026.
Q: What was Galaxy Surfactants' EPS in Q1 FY27?
A: The company reported earnings per share of ₹29.88 for the June 2026 quarter.
Q: What are Galaxy Surfactants' 50-day SMA?
A: The 50-day SMA shown on the daily chart is ₹1,948.72.
Q: What is the current RSI of Galaxy Surfactants?
A: The RSI 14 reading is 83.48, indicating elevated near-term momentum.
Q: What should investors monitor for Galaxy Surfactants?
A: Investors should monitor quarterly revenue, profitability, margins, demand conditions, raw-material costs, currency movements and price behaviour around key technical levels.