
Highlights
- Gujarat Mineral Development Corporation Ltd (NSE: GMDC) fell 6.19% to ₹691.30 after touching an intraday low of ₹689.00.
- The stock remains well above its 21-day SMA of ₹602.35 despite the sharp decline.
- Support is placed at ₹650.00–₹590.00, while resistance is seen near ₹750.00–₹800.00.
Overview
Gujarat Mineral Development Corporation Ltd (NSE: GMDC) declined 6.19% to ₹691.30 on 20-Apr-2026 after opening at ₹728.95. The stock touched an intraday high of ₹732.70 before slipping sharply during the session.
The decline comes after a powerful rally over the past few weeks, during which GMDC moved from below ₹550.00 to above ₹730.00. The latest correction suggests that the stock is witnessing profit booking after a rapid rise.
Fundamental View
For the quarter ended December 2025, Gujarat Mineral Development Corporation Ltd (NSE: GMDC) reported standalone total income of ₹68,043.00 lakh.
Profit before tax stood at ₹18,151.00 lakh, while net profit came in at ₹13,515.00 lakh. Earnings per share was ₹4.25.
The company continues to report strong profitability, which has helped support the broader uptrend in the stock despite the recent pullback.
Technical View
GMDC is still trading comfortably above its 21-day SMA of ₹602.35, indicating that the larger trend remains positive. However, the latest candle reflects a sharp rejection from the ₹730.00 zone after the stock entered an overheated phase.
The 14-day RSI has eased to 66.17 after rising above 75.00 earlier, suggesting that momentum has moderated following the recent correction. Even so, the stock continues to maintain a pattern of higher lows, which means the broader rebound structure is still intact.
Key Technical Levels
The ₹650.00–₹590.00 area may now act as the first major support zone if the current correction extends further. On the upside, GMDC may face resistance near ₹750.00–₹800.00, where the latest rally lost momentum. If the stock remains above ₹650.00, the broader recovery may continue.
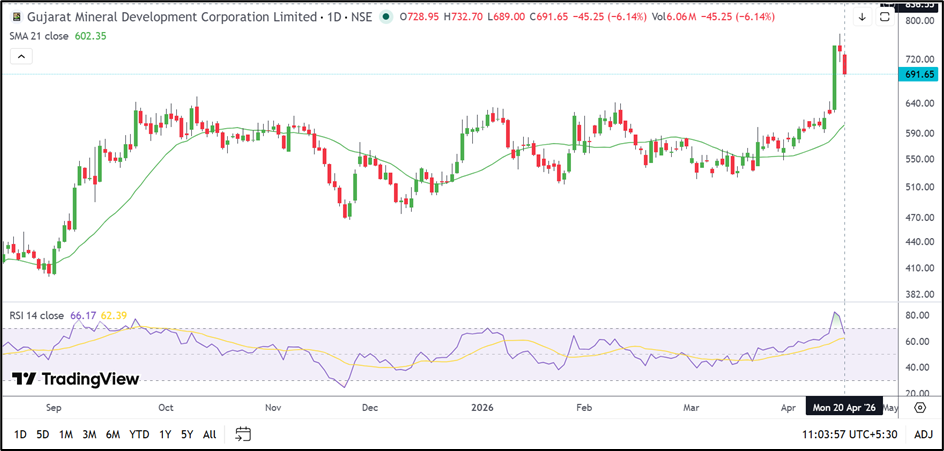
Source: TradingView
Risks to Watch
- A close below ₹650.00 may weaken the present uptrend.
- The recent rejection near ₹730.00 could keep the stock volatile in the short term.
- Sharp rallies are often followed by consolidation or profit booking.
- Failure to regain ₹750.00 may delay the next leg of the rebound.
Summary
Gujarat Mineral Development Corporation Ltd (NSE: GMDC) has seen some profit booking after a sharp rally, but the broader trend remains positive while the stock trades above ₹650.00. The recent pullback may turn into a consolidation phase unless GMDC quickly regains the ₹750.00 zone.
FAQs
Why did GMDC share price fall today?
GMDC declined after witnessing profit booking following a strong rally over the past few weeks.
What are the key support levels for GMDC?
The immediate support zone is placed between ₹650.00 and ₹590.00.
What is the next resistance zone for GMDC shares?
The next resistance area is seen near ₹750.00–₹800.00.
Meta Information
Meta Title: GMDC Share Price Drops After Sharp Rally: Is the Stock Entering a Cooling Phase?
Meta Description: GMDC share price fell 6.19% to ₹691.30 after a sharp rally lost momentum. Check support at ₹650.00–₹590.00, resistance at ₹750.00–₹800.00 and the latest technical outlook.
Meta Keywords: GMDC share price, Gujarat Mineral Development Corporation stock analysis, GMDC technical analysis, GMDC support resistance, GMDC share price today