
Highlights
- HLE Glascoat shares gained over 10% and crossed the ₹400 mark.
- The stock moved well above its 21-day SMA, improving chart structure.
- RSI entered the overbought zone, reflecting accelerated momentum.
Overview
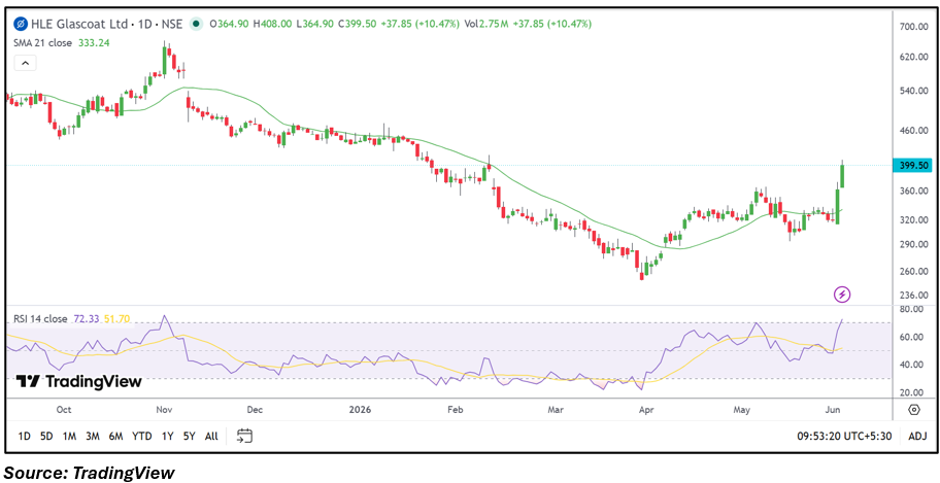
HLE Glascoat (NSE: HLEGLAS) attracted market attention after rising 10.47% to ₹399.50 during trading. The stock touched an intraday high of ₹408.00 and emerged among the top gainers on the NSE. The move comes as investors assess the company's latest quarterly performance and the improving technical setup visible on the charts.
Fundamental View
For the quarter ended March 2026, HLE Glascoat reported consolidated total income of INR 39,280.29 lakh. Profit before tax stood at INR 2,524.85 lakh, while net profit came in at INR 2,014.39 lakh. Earnings per share were reported at INR 2.65.
The latest results reflected profitability during the quarter, providing a fundamental backdrop as the stock attempts to recover from its earlier corrective phase.
Technical View
HLE Glascoat is trading at ₹399.50, comfortably above its 21-day SMA of ₹333.24, indicating a notable improvement in the near-term trend structure. The stock has broken above its recent consolidation zone and is approaching levels not seen in several months. The 14-day RSI stands at 72.33, suggesting momentum has strengthened significantly and entered the overbought region.
Momentum Indicator
The RSI above 70 highlights strong upward momentum. While this supports the current rally, traders may also watch for short-term volatility as the stock adjusts after its sharp advance.
Key Technical Levels
The immediate support level is positioned near ₹379.50. If the stock slips below this zone, the next support is seen around ₹359.50.
On the upside, the first resistance level is placed near ₹419.50. A sustained move above this zone could open the door toward the next resistance area around ₹439.50.
Risks to Watch
- Overbought RSI conditions may trigger volatility.
- Failure to hold above recent breakout levels.
- Earnings growth may remain uneven across quarters.
- Broader market weakness could impact sentiment.
Summary
HLE Glascoat has staged a notable recovery, moving above its 21-day SMA and breaking out of a prolonged consolidation phase. The latest quarterly results showed profitability, while technical indicators point to strengthening momentum. The stock is now testing important resistance zones, making upcoming price action around ₹420 an important area for traders to monitor.
FAQs
- Why are HLE Glascoat shares rising?
The stock gained after a breakout above recent trading ranges alongside positive momentum and profitable quarterly results. - Has HLE Glascoat confirmed a trend reversal?
The move above the 21-day SMA and recent breakout suggest improving trend conditions, though follow-through remains important. - What levels should traders monitor?
Key support levels are ₹379.50 and ₹359.50, while resistance levels are ₹419.50 and ₹439.50.